OPEN-SOURCE SCRIPT
업데이트됨 Up/Down Volume Ratio
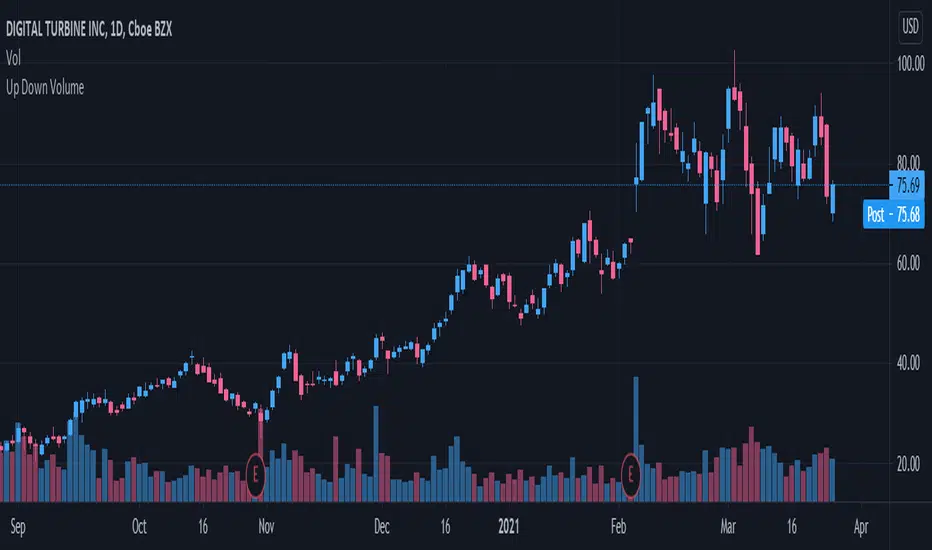
Up/Down Volume Ratio is calculated by summing volume on days when it closes up and divide that total by the volume on days when the stock closed down.
High volume up days are typically a sign of accumulation(buying) by big players, while down days are signs of distribution(selling) by big market players. The Up Down volume ratio takes this assumption and turns it into a tangible number that's easier for the trader to understand. My formula is calculated using the past 50 periods, be warned it will not display a value for stocks with under 50 periods of trading history. This indicator is great for identify accumulation of growth stocks early on in their moves, most of the time you would like a growth stocks U/D value to be above 2, showing institutional sponsorship of a stock.
Up/Down Volume value interpretation:
U/D < 1 -> Bearish outlook, as sellers are in control
U/D = 1 -> Sellers and Buyers are equal
U/D > 1 -> Bullish outlook, as buyers are in control
U/D > 2 -> Bullish outlook, significant accumulation underway by market makers
U/D >= 3 -> MONSTER STOCK ALERT, market makers can not get enough of this stock and are ravenous to buy more
U/D values greater than 2 are rare and typically do not last very long, and U/D >= 3 are extremely rare one example I kind find of a stock's U/D peaking above 3 was Google back in 2005.
MAKE SURE TO HIT THE SETTINGS WHEEL AND CHECK THE BOX NEXT TO PLOT IN ORDER TO GET RID OF THE PLOTTED LINE.
릴리즈 노트
No more need to disable plot!오픈 소스 스크립트
트레이딩뷰의 진정한 정신에 따라, 이 스크립트의 작성자는 이를 오픈소스로 공개하여 트레이더들이 기능을 검토하고 검증할 수 있도록 했습니다. 작성자에게 찬사를 보냅니다! 이 코드는 무료로 사용할 수 있지만, 코드를 재게시하는 경우 하우스 룰이 적용된다는 점을 기억하세요.
면책사항
해당 정보와 게시물은 금융, 투자, 트레이딩 또는 기타 유형의 조언이나 권장 사항으로 간주되지 않으며, 트레이딩뷰에서 제공하거나 보증하는 것이 아닙니다. 자세한 내용은 이용 약관을 참조하세요.
오픈 소스 스크립트
트레이딩뷰의 진정한 정신에 따라, 이 스크립트의 작성자는 이를 오픈소스로 공개하여 트레이더들이 기능을 검토하고 검증할 수 있도록 했습니다. 작성자에게 찬사를 보냅니다! 이 코드는 무료로 사용할 수 있지만, 코드를 재게시하는 경우 하우스 룰이 적용된다는 점을 기억하세요.
면책사항
해당 정보와 게시물은 금융, 투자, 트레이딩 또는 기타 유형의 조언이나 권장 사항으로 간주되지 않으며, 트레이딩뷰에서 제공하거나 보증하는 것이 아닙니다. 자세한 내용은 이용 약관을 참조하세요.