PROTECTED SOURCE SCRIPT
Snapfront Market Clarity Index (MCI) — Lite
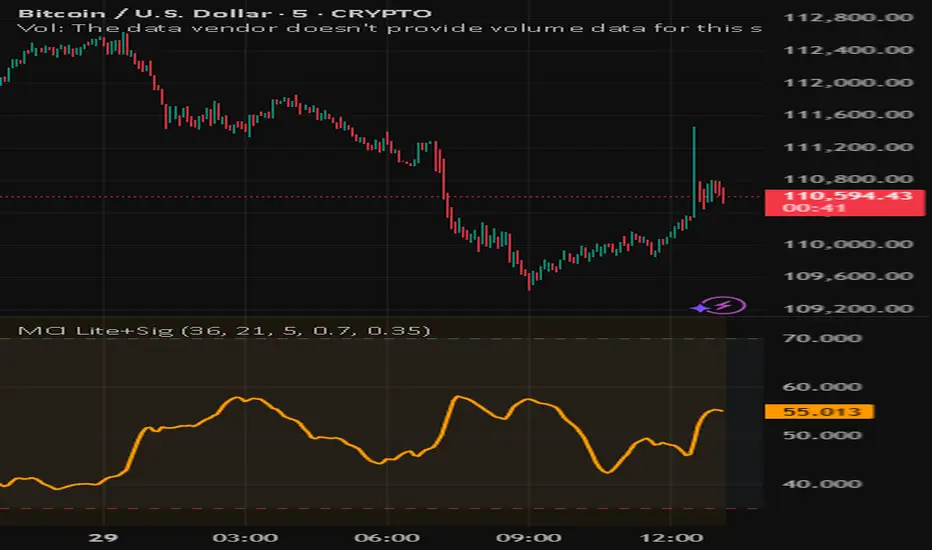
Market Clarity Index (MCI) — Lite + Signals
The Market Clarity Index (MCI) measures trend clarity vs. noise using returns, drift, and volume shock dynamics. Values are normalized through a φ²-based sigmoid for smooth, interpretable signals.
Features:
Clear 0–100 scale (Lite version)
Heatmap background for clarity regimes
Bull/Bear signal arrows with EMA filter
High/Low threshold lines for easy context
Trading Logic:
✅ Bull signal when MCI crosses into the high zone with price above EMA
❌ Bear signal when MCI crosses into the low zone with price below EMA
Use MCI as a trend filter, entry trigger, or market condition gauge across any timeframe or asset.
보호된 스크립트입니다
이 스크립트는 비공개 소스로 게시됩니다. 하지만 이를 자유롭게 제한 없이 사용할 수 있습니다 – 자세한 내용은 여기에서 확인하세요.
면책사항
해당 정보와 게시물은 금융, 투자, 트레이딩 또는 기타 유형의 조언이나 권장 사항으로 간주되지 않으며, 트레이딩뷰에서 제공하거나 보증하는 것이 아닙니다. 자세한 내용은 이용 약관을 참조하세요.
보호된 스크립트입니다
이 스크립트는 비공개 소스로 게시됩니다. 하지만 이를 자유롭게 제한 없이 사용할 수 있습니다 – 자세한 내용은 여기에서 확인하세요.
면책사항
해당 정보와 게시물은 금융, 투자, 트레이딩 또는 기타 유형의 조언이나 권장 사항으로 간주되지 않으며, 트레이딩뷰에서 제공하거나 보증하는 것이 아닙니다. 자세한 내용은 이용 약관을 참조하세요.