OPEN-SOURCE SCRIPT
Primitive Delta Divergence
Primitive Delta Divergence
This indicator detects volume-price divergences by analyzing the relationship between price direction and volume bias over a rolling lookback period, revealing potential momentum shifts before they become apparent in price action alone.
Instead of relying solely on price movements, you can identify moments when volume sentiment contradicts price direction — a core concept borrowed from footprint chart analysis, adapted for traditional bar charts.
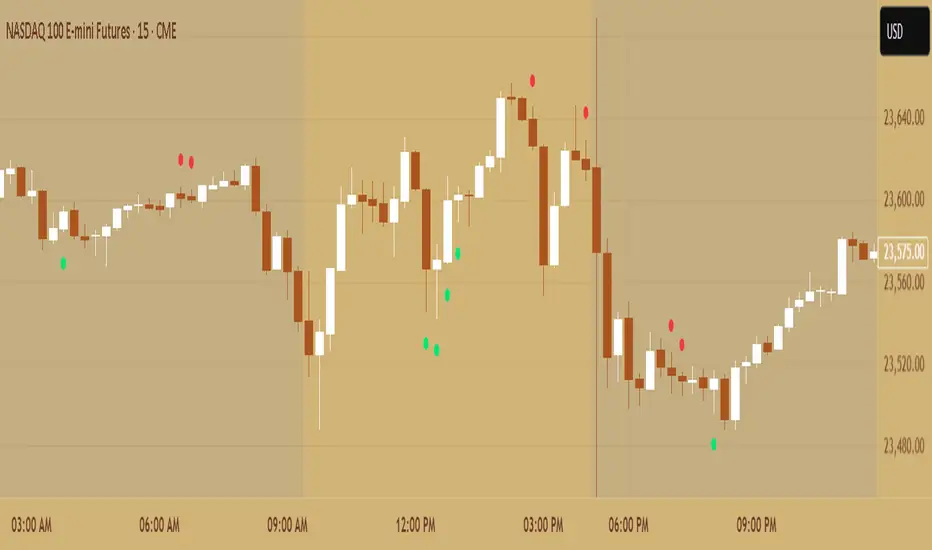
For example, when price moves higher but volume is predominantly bearish, or when price declines while volume shows bullish accumulation.
🔹 How it works
Lookback Period (n) → defines the rolling window for analyzing price and volume relationships
Creates a "meta-candle" from the lookback period, comparing its open vs. close for price bias
Volume classification → separates each bar's volume into bullish (green candles), bearish (red candles), or neutral (doji candles)
Volume bias calculation → generates a continuous score (-1 to +1) representing the directional volume pressure
Plots divergence signals when price direction and volume bias disagree
🔹 Use cases
Spot early momentum exhaustion when price and volume move in opposite directions
Identify potential reversal zones where volume suggests underlying weakness or strength
Enhance entry/exit timing by incorporating volume-based confirmation alongside price action
Apply footprint-style analysis to any timeframe without specialized charting tools
✨ Primitive Delta Divergence reveals the hidden story volume tells about price, uncovering divergences that traditional indicators might miss.
This indicator detects volume-price divergences by analyzing the relationship between price direction and volume bias over a rolling lookback period, revealing potential momentum shifts before they become apparent in price action alone.
Instead of relying solely on price movements, you can identify moments when volume sentiment contradicts price direction — a core concept borrowed from footprint chart analysis, adapted for traditional bar charts.
For example, when price moves higher but volume is predominantly bearish, or when price declines while volume shows bullish accumulation.
🔹 How it works
Lookback Period (n) → defines the rolling window for analyzing price and volume relationships
Creates a "meta-candle" from the lookback period, comparing its open vs. close for price bias
Volume classification → separates each bar's volume into bullish (green candles), bearish (red candles), or neutral (doji candles)
Volume bias calculation → generates a continuous score (-1 to +1) representing the directional volume pressure
Plots divergence signals when price direction and volume bias disagree
🔹 Use cases
Spot early momentum exhaustion when price and volume move in opposite directions
Identify potential reversal zones where volume suggests underlying weakness or strength
Enhance entry/exit timing by incorporating volume-based confirmation alongside price action
Apply footprint-style analysis to any timeframe without specialized charting tools
✨ Primitive Delta Divergence reveals the hidden story volume tells about price, uncovering divergences that traditional indicators might miss.
오픈 소스 스크립트
트레이딩뷰의 진정한 정신에 따라, 이 스크립트의 작성자는 이를 오픈소스로 공개하여 트레이더들이 기능을 검토하고 검증할 수 있도록 했습니다. 작성자에게 찬사를 보냅니다! 이 코드는 무료로 사용할 수 있지만, 코드를 재게시하는 경우 하우스 룰이 적용된다는 점을 기억하세요.
면책사항
해당 정보와 게시물은 금융, 투자, 트레이딩 또는 기타 유형의 조언이나 권장 사항으로 간주되지 않으며, 트레이딩뷰에서 제공하거나 보증하는 것이 아닙니다. 자세한 내용은 이용 약관을 참조하세요.
오픈 소스 스크립트
트레이딩뷰의 진정한 정신에 따라, 이 스크립트의 작성자는 이를 오픈소스로 공개하여 트레이더들이 기능을 검토하고 검증할 수 있도록 했습니다. 작성자에게 찬사를 보냅니다! 이 코드는 무료로 사용할 수 있지만, 코드를 재게시하는 경우 하우스 룰이 적용된다는 점을 기억하세요.
면책사항
해당 정보와 게시물은 금융, 투자, 트레이딩 또는 기타 유형의 조언이나 권장 사항으로 간주되지 않으며, 트레이딩뷰에서 제공하거나 보증하는 것이 아닙니다. 자세한 내용은 이용 약관을 참조하세요.