OPEN-SOURCE SCRIPT
Significant Volume with Price Changes Highlighted
Significant Volume with Price Changes Highlighted
The "Significant Volume with Price Changes Highlighted" indicator by PappyTrading is a powerful tool designed to help traders identify significant volume spikes and price changes in the market. This indicator overlays the volume bars on the price chart and highlights them based on specific volume and price change conditions, providing a clear visual representation of market activity.
What It Does
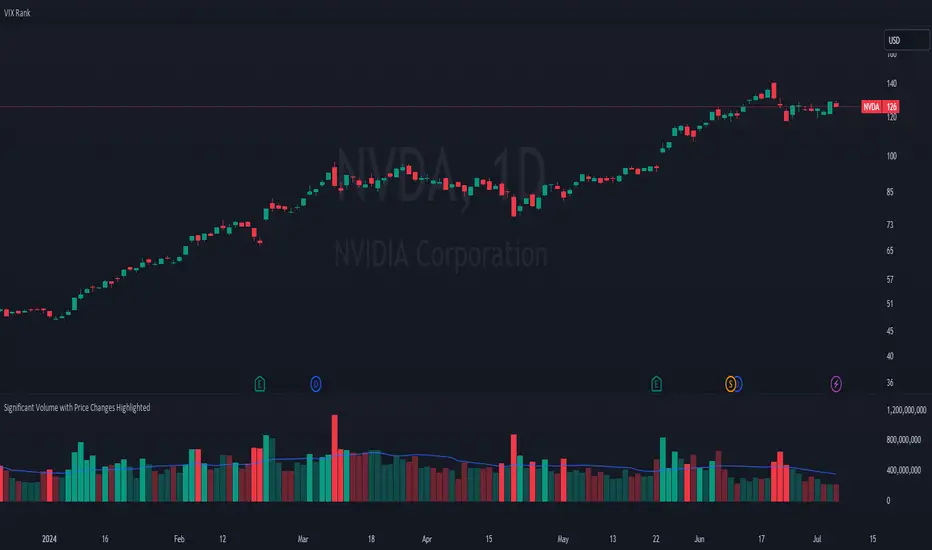
This indicator calculates the moving average of the volume over a specified period and compares the current volume to this average. It also calculates the daily percentage change relative to the previous day's close and compares this to its moving average. The volume bars are then color-coded based on the following conditions:
Bright Green (#089981): Indicates a significant volume spike with an above-average price increase.
Bright Red (#f23645): Indicates a significant volume spike with an above-average price decrease.
Green with 60% transparency: Indicates a normal up day with a price increase but not a significant volume spike.
Red with 60% transparency: Indicates a normal down day with a price decrease but not a significant volume spike.
Additionally, the indicator plots a 20-period simple moving average (SMA) of the volume, providing a reference point to understand the general volume trend.
How It Works
Volume Calculation:
The indicator calculates the 20-period SMA of the volume and compares the current volume to this average to determine if there is a significant volume spike.
Price Change Calculation:
The indicator calculates the daily percentage change in price relative to the previous day's close and compares this to the 20-period SMA of the percentage change to identify significant price movements.
Color Coding:
The volume bars are color-coded based on the combination of the volume and price change conditions. This visual representation allows traders to quickly identify significant market activities.
How to Use It
Overlay on Chart:
Add the "Significant Volume with Price Changes Highlighted" indicator to your chart. The volume bars will be displayed at the bottom of the chart, color-coded based on the conditions described above.
Identify Market Activity:
Use the color-coded volume bars to identify significant market activities. Bright green bars indicate strong buying pressure, while bright red bars indicate strong selling pressure. Transparent green and red bars indicate normal market activity without significant volume spikes.
Volume Moving Average:
The blue line represents the 20-period SMA of the volume. Use this as a reference to understand the general volume trend and identify deviations from the average.
Concepts Underlying the Calculations
Volume Spikes: Significant volume spikes often precede or accompany major market moves. By highlighting these spikes, traders can gain insights into potential market turning points or continuation patterns.
Price Changes: Large price changes relative to the previous day's close indicate strong market momentum. By comparing these changes to their moving average, the indicator helps traders identify unusually strong buying or selling pressure.
This indicator is ideal for traders who want to gain a deeper understanding of market dynamics by analyzing volume and price changes together. It is suitable for various trading styles, including trend following, swing trading, and scalping.
The "Significant Volume with Price Changes Highlighted" indicator by PappyTrading is a powerful tool designed to help traders identify significant volume spikes and price changes in the market. This indicator overlays the volume bars on the price chart and highlights them based on specific volume and price change conditions, providing a clear visual representation of market activity.
What It Does
This indicator calculates the moving average of the volume over a specified period and compares the current volume to this average. It also calculates the daily percentage change relative to the previous day's close and compares this to its moving average. The volume bars are then color-coded based on the following conditions:
Bright Green (#089981): Indicates a significant volume spike with an above-average price increase.
Bright Red (#f23645): Indicates a significant volume spike with an above-average price decrease.
Green with 60% transparency: Indicates a normal up day with a price increase but not a significant volume spike.
Red with 60% transparency: Indicates a normal down day with a price decrease but not a significant volume spike.
Additionally, the indicator plots a 20-period simple moving average (SMA) of the volume, providing a reference point to understand the general volume trend.
How It Works
Volume Calculation:
The indicator calculates the 20-period SMA of the volume and compares the current volume to this average to determine if there is a significant volume spike.
Price Change Calculation:
The indicator calculates the daily percentage change in price relative to the previous day's close and compares this to the 20-period SMA of the percentage change to identify significant price movements.
Color Coding:
The volume bars are color-coded based on the combination of the volume and price change conditions. This visual representation allows traders to quickly identify significant market activities.
How to Use It
Overlay on Chart:
Add the "Significant Volume with Price Changes Highlighted" indicator to your chart. The volume bars will be displayed at the bottom of the chart, color-coded based on the conditions described above.
Identify Market Activity:
Use the color-coded volume bars to identify significant market activities. Bright green bars indicate strong buying pressure, while bright red bars indicate strong selling pressure. Transparent green and red bars indicate normal market activity without significant volume spikes.
Volume Moving Average:
The blue line represents the 20-period SMA of the volume. Use this as a reference to understand the general volume trend and identify deviations from the average.
Concepts Underlying the Calculations
Volume Spikes: Significant volume spikes often precede or accompany major market moves. By highlighting these spikes, traders can gain insights into potential market turning points or continuation patterns.
Price Changes: Large price changes relative to the previous day's close indicate strong market momentum. By comparing these changes to their moving average, the indicator helps traders identify unusually strong buying or selling pressure.
This indicator is ideal for traders who want to gain a deeper understanding of market dynamics by analyzing volume and price changes together. It is suitable for various trading styles, including trend following, swing trading, and scalping.
오픈 소스 스크립트
트레이딩뷰의 진정한 정신에 따라, 이 스크립트의 작성자는 이를 오픈소스로 공개하여 트레이더들이 기능을 검토하고 검증할 수 있도록 했습니다. 작성자에게 찬사를 보냅니다! 이 코드는 무료로 사용할 수 있지만, 코드를 재게시하는 경우 하우스 룰이 적용된다는 점을 기억하세요.
면책사항
해당 정보와 게시물은 금융, 투자, 트레이딩 또는 기타 유형의 조언이나 권장 사항으로 간주되지 않으며, 트레이딩뷰에서 제공하거나 보증하는 것이 아닙니다. 자세한 내용은 이용 약관을 참조하세요.
오픈 소스 스크립트
트레이딩뷰의 진정한 정신에 따라, 이 스크립트의 작성자는 이를 오픈소스로 공개하여 트레이더들이 기능을 검토하고 검증할 수 있도록 했습니다. 작성자에게 찬사를 보냅니다! 이 코드는 무료로 사용할 수 있지만, 코드를 재게시하는 경우 하우스 룰이 적용된다는 점을 기억하세요.
면책사항
해당 정보와 게시물은 금융, 투자, 트레이딩 또는 기타 유형의 조언이나 권장 사항으로 간주되지 않으며, 트레이딩뷰에서 제공하거나 보증하는 것이 아닙니다. 자세한 내용은 이용 약관을 참조하세요.