INVITE-ONLY SCRIPT
업데이트됨 Open/Close Volume
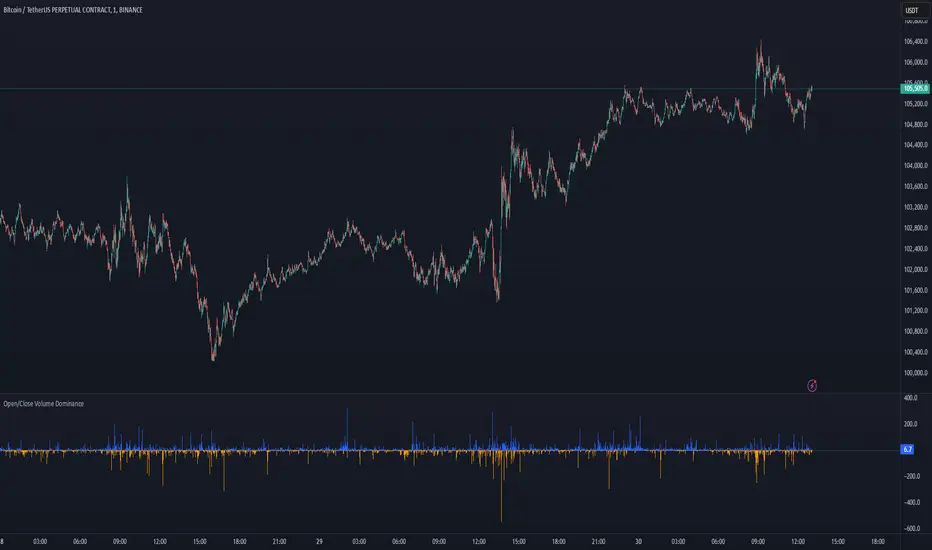
Open/Close Volume Indicator
The Open/Close Volume Indicator provides a breakdown of trading volume based on Open Interest (OI) changes. It helps identify whether the trading volume is driven by opening new positions (Open Volume) or closing existing positions (Close Volume).
Key Features:
Use Case:
This indicator is ideal for futures traders who want to analyze market sentiment and understand whether market activity is being driven by the initiation of new trades or the closing of existing ones.
How It Works:
The Open/Close Volume Indicator provides a breakdown of trading volume based on Open Interest (OI) changes. It helps identify whether the trading volume is driven by opening new positions (Open Volume) or closing existing positions (Close Volume).
Key Features:
- Visual Breakdown of Volume:
Green bars represent Open Volume (new positions being added).
Red bars represent Close Volume (existing positions being closed). - Dynamic Open Interest Data: Tracks changes in Open Interest to calculate the distribution of Open and Close Volumes.
Adapts automatically to the current chart's symbol or a custom user-specified symbol. - Error Handling: Displays an alert when Open Interest data is unavailable for the selected symbol.
- Zero-Line Reference:
- Includes a gray dotted line at 0 for easy reference between Open and Close Volumes.
- Includes a gray dotted line at 0 for easy reference between Open and Close Volumes.
Use Case:
This indicator is ideal for futures traders who want to analyze market sentiment and understand whether market activity is being driven by the initiation of new trades or the closing of existing ones.
How It Works:
- Open Interest Change: Positive OI change → Open Volume.
Negative OI change → Close Volume.
No OI change → All trading volume is considered Close Volume. - Data Representation:
- Open Volume is plotted above the zero line (positive values).
- Close Volume is plotted below the zero line (negative values).
- Open Volume is plotted above the zero line (positive values).
릴리즈 노트
📊 Open/Close Volume + DominanceAn advanced volume analysis tool utilizing Open Interest (OI) data to track market positioning.
🔍 Overview
This indicator provides a unique way to separate Open Volume and Close Volume, giving traders insight into whether the market is driven by new contract openings or position closings.
Additionally, it features a Dominance metric, visually representing whether more contracts are being opened or closed over time, helping traders gauge shifts in market behavior.
📌 Key Features:
- [] Tracks Open and Close Volume based on Open Interest movements.
[] Visualizes market participation trends with a unique Dominance metric.
[] Customizable color settings for Open Volume, Close Volume, and Dominance.
[] Works on all futures contracts where Open Interest data is available.
📊 How It Works (Conceptual Explanation)
- [] Open Interest Change is used to detect market positioning shifts.
[] Volume is categorized into Open Volume and Close Volume to help distinguish market intent. - Dominance measures the balance between opening and closing contracts and displays it in an easy-to-read visual format.
📌 What You See on the Chart:
- [] [color=green]Green bars:[/color] Represent Open Volume (contracts being opened).
[] [color=red]Red bars:[/color] Represent Close Volume (contracts being closed).
[] [color=blue]Blue dominance bars:[/color] More contracts opened than closed.
[] [color=orange]Orange dominance bars:[/color] More contracts closed than opened.
This methodology allows traders to analyze market participation without relying solely on price movement.
⚡ How to Use This Indicator
This indicator helps you analyze market positioning dynamics by tracking contract openings vs. closings based on Open Interest (OI) changes.
📌 Key Interpretations:
- [] [color=blue]🔵 Blue Dominance Bars[/color] → Indicate higher contract openings relative to closings.
[] [color=orange]🟠 Orange Dominance Bars[/color] → Indicate higher contract closings relative to openings. - Compare Open/Close Volume with price movement to identify potential market behavior shifts.
📊 Market Action & Open Interest Changes
The table below explains how different market actions impact Open Interest.
Market Action Counterparty Limit Order Action OI Change
Market Buy (Open Long) Limit Close Long Open Long meets Close Long OI = 0
Market Buy (Open Long) Limit Open Short Open Long meets Open Short OI + 1
Market Buy (Close Short) Limit Close Long Close Short meets Close Long OI - 1
Market Buy (Close Short) Limit Open Short Close Short meets Open Short OI = 0
Market Sell (Open Short) Limit Open Long Open Short meets Open Long OI + 1
Market Sell (Open Short) Limit Close Short Open Short meets Close Short OI = 0
Market Sell (Close Long) Limit Open Long Close Long meets Open Long OI = 0
Market Sell (Close Long) Limit Close Short Close Long meets Close Short OI - 1
By analyzing Open/Close Volume and Dominance along with price movement, traders can better understand market positioning and potential liquidity shifts. 🚀
⚙️ Customization Options
- Users can adjust colors for:
Open Volume (default: Green)
Close Volume (default: Red)
Dominance (More Opened Contracts) (default: Blue)
Dominance (More Closed Contracts) (default: Orange) - By default, only Dominance is enabled (Open/Close Volume can be manually turned on).
🚀 Why This Indicator is Unique
- [] Provides exclusive insights into market positioning using Open Interest.
[] Offers a new way to analyze contract flows in futures markets.
[] Works seamlessly on Futures and Derivatives markets.
[] Fully customizable for different trading strategies.
📌 Important Notes
- [] This indicator is designed for Futures traders and relies on Open Interest data.
[] It does not work on spot markets (e.g., BTC/USD) since spot markets do not have Open Interest.
📈 Example Use Cases
- [] Detect institutional positioning changes by tracking Open Interest shifts.
[] Identify potential trend reversals when market positioning changes significantly. - Combine with price action or technical indicators for a complete trading strategy.
📢 Disclaimer
This script is for educational purposes only. It does not provide financial advice or guarantee future results. Use it alongside proper risk management and other trading strategies.
✅ Summary
📊 Open/Close Volume + Dominance is an innovative tool designed to help traders monitor contract openings and closings using Open Interest data. By analyzing these shifts in market positioning, traders can gain deeper insights into market behavior and liquidity flows.
🚀 Try it now & let us know your feedback! 🔥🔥🔥
릴리즈 노트
removed Open and Close volume, only dominance 초대 전용 스크립트
이 스크립트는 작성자가 승인한 사용자만 접근할 수 있습니다. 사용하려면 요청 후 승인을 받아야 하며, 일반적으로 결제 후에 허가가 부여됩니다. 자세한 내용은 아래 작성자의 안내를 따르거나 Angick에게 직접 문의하세요.
트레이딩뷰는 스크립트의 작동 방식을 충분히 이해하고 작성자를 완전히 신뢰하지 않는 이상, 해당 스크립트에 비용을 지불하거나 사용하는 것을 권장하지 않습니다. 커뮤니티 스크립트에서 무료 오픈소스 대안을 찾아보실 수도 있습니다.
작성자 지시 사항
Terms of Use:
"By requesting access to this script, you agree to use it for personal trading purposes only. Redistribution is prohibited."
Request:
"Send me a private message on TradingView with your username and reason for requesting access."
면책사항
해당 정보와 게시물은 금융, 투자, 트레이딩 또는 기타 유형의 조언이나 권장 사항으로 간주되지 않으며, 트레이딩뷰에서 제공하거나 보증하는 것이 아닙니다. 자세한 내용은 이용 약관을 참조하세요.
초대 전용 스크립트
이 스크립트는 작성자가 승인한 사용자만 접근할 수 있습니다. 사용하려면 요청 후 승인을 받아야 하며, 일반적으로 결제 후에 허가가 부여됩니다. 자세한 내용은 아래 작성자의 안내를 따르거나 Angick에게 직접 문의하세요.
트레이딩뷰는 스크립트의 작동 방식을 충분히 이해하고 작성자를 완전히 신뢰하지 않는 이상, 해당 스크립트에 비용을 지불하거나 사용하는 것을 권장하지 않습니다. 커뮤니티 스크립트에서 무료 오픈소스 대안을 찾아보실 수도 있습니다.
작성자 지시 사항
Terms of Use:
"By requesting access to this script, you agree to use it for personal trading purposes only. Redistribution is prohibited."
Request:
"Send me a private message on TradingView with your username and reason for requesting access."
면책사항
해당 정보와 게시물은 금융, 투자, 트레이딩 또는 기타 유형의 조언이나 권장 사항으로 간주되지 않으며, 트레이딩뷰에서 제공하거나 보증하는 것이 아닙니다. 자세한 내용은 이용 약관을 참조하세요.