OPEN-SOURCE SCRIPT
Murrey Math Extremes Comparator
HOW IT WORKS
Creates two murrey math oscillators (hidden) one with 256 length another with 32 length and compare each other.
WHAT GIVE ME THIS SCRIPT
The script can give you very valuable information:
- Main Trend
- Pullbacks detections
- Extreme overbought oversold prices alerts
- Divergences
- Any timeframe usage
REFERENCES OF USAGE
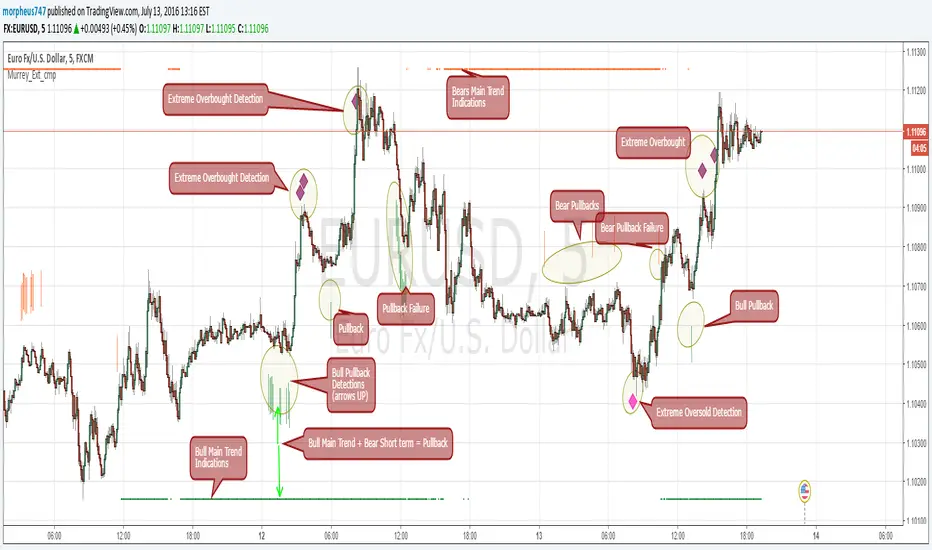
Main Trend Indications
****The main trend is indicated with green(bull) or red(bears) small "triangles" on the bottom(bull) or the top(bears) of the chart.
*****To detect the Bull/Bear major trend the script use 256 murrey, if > 0 (green) we are uptrend in other cases we are downtrend
Pullback detection
****The pullbacks are indicated with Green(bull) or red(bears) medium "Arrows"
*****To detect pullbacks the system compare the long term murrey with the short term murrey, if long term is Green(green triangles)
*****so we are in a main bull trend, if the short term murrey make an extreme low then the pullback is indicated
*****The same for the short pullback, if long term murrey is RED and we have an extreme green short term murrey we shot a red arrow
Extreme Overbught/Oversold
****The extreme OO is indicated with fancy diamonds
*****To detect the Extremes price movements we combine the two murrey, if Long Term Murrey is overbought and short term murrey too
*****Then the diamond show on the screen obove or below based on the extreme if overbought or oversold
Strategy Resume:
Triangles indicate Major Trend Up/Down
Arrows Indicate Continuation pullbacks
Diamonds Indicate Extreme Prices
GUIDE HOW TO IMAGES

How it's works Behind Scene

Creates two murrey math oscillators (hidden) one with 256 length another with 32 length and compare each other.
WHAT GIVE ME THIS SCRIPT
The script can give you very valuable information:
- Main Trend
- Pullbacks detections
- Extreme overbought oversold prices alerts
- Divergences
- Any timeframe usage
REFERENCES OF USAGE
Main Trend Indications
****The main trend is indicated with green(bull) or red(bears) small "triangles" on the bottom(bull) or the top(bears) of the chart.
*****To detect the Bull/Bear major trend the script use 256 murrey, if > 0 (green) we are uptrend in other cases we are downtrend
Pullback detection
****The pullbacks are indicated with Green(bull) or red(bears) medium "Arrows"
*****To detect pullbacks the system compare the long term murrey with the short term murrey, if long term is Green(green triangles)
*****so we are in a main bull trend, if the short term murrey make an extreme low then the pullback is indicated
*****The same for the short pullback, if long term murrey is RED and we have an extreme green short term murrey we shot a red arrow
Extreme Overbught/Oversold
****The extreme OO is indicated with fancy diamonds
*****To detect the Extremes price movements we combine the two murrey, if Long Term Murrey is overbought and short term murrey too
*****Then the diamond show on the screen obove or below based on the extreme if overbought or oversold
Strategy Resume:
Triangles indicate Major Trend Up/Down
Arrows Indicate Continuation pullbacks
Diamonds Indicate Extreme Prices
GUIDE HOW TO IMAGES
How it's works Behind Scene
오픈 소스 스크립트
트레이딩뷰의 진정한 정신에 따라, 이 스크립트의 작성자는 이를 오픈소스로 공개하여 트레이더들이 기능을 검토하고 검증할 수 있도록 했습니다. 작성자에게 찬사를 보냅니다! 이 코드는 무료로 사용할 수 있지만, 코드를 재게시하는 경우 하우스 룰이 적용된다는 점을 기억하세요.
면책사항
해당 정보와 게시물은 금융, 투자, 트레이딩 또는 기타 유형의 조언이나 권장 사항으로 간주되지 않으며, 트레이딩뷰에서 제공하거나 보증하는 것이 아닙니다. 자세한 내용은 이용 약관을 참조하세요.
오픈 소스 스크립트
트레이딩뷰의 진정한 정신에 따라, 이 스크립트의 작성자는 이를 오픈소스로 공개하여 트레이더들이 기능을 검토하고 검증할 수 있도록 했습니다. 작성자에게 찬사를 보냅니다! 이 코드는 무료로 사용할 수 있지만, 코드를 재게시하는 경우 하우스 룰이 적용된다는 점을 기억하세요.
면책사항
해당 정보와 게시물은 금융, 투자, 트레이딩 또는 기타 유형의 조언이나 권장 사항으로 간주되지 않으며, 트레이딩뷰에서 제공하거나 보증하는 것이 아닙니다. 자세한 내용은 이용 약관을 참조하세요.