INVITE-ONLY SCRIPT
업데이트됨 MVolume‴ | Multi Volume Indicator‴
Hello Traders!
This simple but yet efficient indicator view presents the Volume with the following benefits:
1. both buyer and seller volume are shown separately and above zero line, this way its possible to see which side is dominant;
2. both buyer and seller volume are shown separately, with buyers above the zero line and sellers bellow the zero line. The dominant side is shown in its darker color version;
3. 20 period Moving Average line is calculated separately and plotted for each side (buyer/seller);
4. 50% of the 20 period Moving Average line is calculated separately and plotted for each side (buyer/seller);
5. possibility to apply Directional OHLC values to enhance the buyer/seller movement interpretation.
p.s.: the chart presents two MVol indicators to let you see the different possible views.
To request access to this invite-only script, please DM me.
릴리즈 노트
Just minor adjustment to the INPUT panel.릴리즈 노트
What's New- runs on Pine 4
- size arrow for buyer (blue) and seller (red) bar slice: show you if the current slices are greater or not if compared to the previous bar slices
- provides buyer and seller slice percentage and average number of trades
릴리즈 노트
Now you are allowed to visualize the accumulated volume and you define the best period to view it for you asset.This is a game changing for your analysis!
릴리즈 노트
(updating the right chart)릴리즈 노트
(one more chart update, now with description)릴리즈 노트
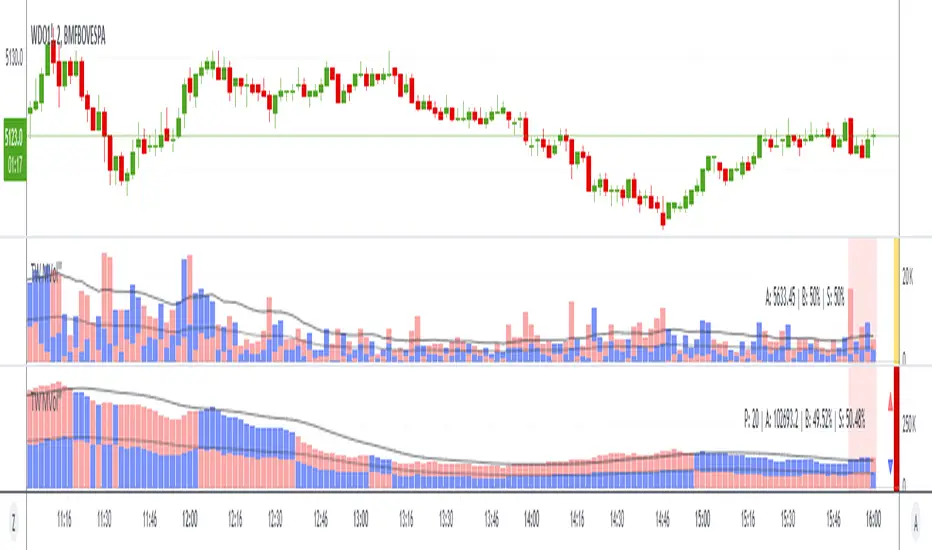
Now you can plot the Volume with a Accumulated format and you define the period to be considered.Look at the image, the:
1. top MVol: is the regular volume you are already familiar, where the buy and sell partitions of each volume bar are shown separately;
2. bottom MVol: is the 5 period Accumulated Volume. Notice how the buy blue bars takes controle during a certain period of time and than the sell red bars take over during the next time period of time.
Hope you like it!
릴리즈 노트
Just minor but important updates:1. now the volume can be ploted with an accumulated format;
2. it's possible to choose the desired period to present accumulated volume. The pre-defined period values are: 6, 20, 72, 100, 200;
3. there's a field to enter your prefered accumulated volume period.
초대 전용 스크립트
이 스크립트는 작성자가 승인한 사용자만 접근할 수 있습니다. 사용하려면 요청 후 승인을 받아야 하며, 일반적으로 결제 후에 허가가 부여됩니다. 자세한 내용은 아래 작성자의 안내를 따르거나 MarceloTorres에게 직접 문의하세요.
트레이딩뷰는 스크립트의 작동 방식을 충분히 이해하고 작성자를 완전히 신뢰하지 않는 이상, 해당 스크립트에 비용을 지불하거나 사용하는 것을 권장하지 않습니다. 커뮤니티 스크립트에서 무료 오픈소스 대안을 찾아보실 수도 있습니다.
작성자 지시 사항
To have access to this indicator, please DM me.
Don't contact me in the comment area.
TRADEWISER | Marcelo Torres
marcelo@tradewiser.pro
Vídeo-Análise completa diária no YouTube:
youtube.com/c/TradeWiserPro
Curso/AE
CursoAE.TradeWiser.pro
@TradeWiserPro
Telegram, Twitter, Facebook, LinkedIn, Instagram
marcelo@tradewiser.pro
Vídeo-Análise completa diária no YouTube:
youtube.com/c/TradeWiserPro
Curso/AE
CursoAE.TradeWiser.pro
@TradeWiserPro
Telegram, Twitter, Facebook, LinkedIn, Instagram
면책사항
해당 정보와 게시물은 금융, 투자, 트레이딩 또는 기타 유형의 조언이나 권장 사항으로 간주되지 않으며, 트레이딩뷰에서 제공하거나 보증하는 것이 아닙니다. 자세한 내용은 이용 약관을 참조하세요.