OPEN-SOURCE SCRIPT
업데이트됨 Advanced Trend Channel Detection (Log Scale)
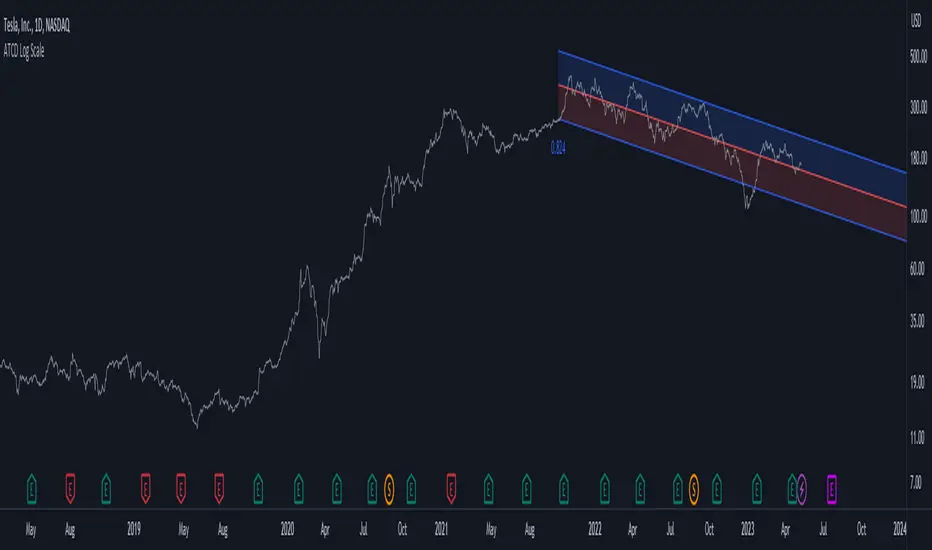
The Advanced Trend Channel Detection (Log Scale) indicator is designed to identify the strongest trend channels using logarithmic scaling. It does this by calculating the highest Pearson's R value among all length inputs and then determining which length input to use for the selected slope, average, and intercept. The script then draws the upper and lower deviation lines on the chart based on the selected slope, average, and intercept, and optionally displays the Pearson's R value.
To use this indicator, you will need to switch to logarithmic scale. There are several advantages to using logarithmic scale over regular scale. Firstly, logarithmic scale provides a better visualization of data that spans multiple orders of magnitude by compressing large ranges of values into a smaller space. Secondly, logarithmic scale can help to minimize the impact of outliers, making it easier to identify patterns and trends in the data. Finally, logarithmic scale is often utilized in scientific contexts as it can reveal relationships between variables that may not be visible on a linear scale.
If the trend channel does not appear on the chart, it may be necessary to scroll back to view historical data. The indicator uses past price data to calculate the trend channel, so if there is not enough historical data visible on the chart, the indicator may not be able to identify the trend channel. In this case, the user should adjust the chart's timeframe or zoom out to view more historical data. Additionally, the indicator may need to be recalibrated if there is a significant shift in market conditions or if the selected length input is no longer appropriate.
릴리즈 노트
Correction on display of length names오픈 소스 스크립트
트레이딩뷰의 진정한 정신에 따라, 이 스크립트의 작성자는 이를 오픈소스로 공개하여 트레이더들이 기능을 검토하고 검증할 수 있도록 했습니다. 작성자에게 찬사를 보냅니다! 이 코드는 무료로 사용할 수 있지만, 코드를 재게시하는 경우 하우스 룰이 적용된다는 점을 기억하세요.
Plan the trade ⚡ Trade the plan
면책사항
해당 정보와 게시물은 금융, 투자, 트레이딩 또는 기타 유형의 조언이나 권장 사항으로 간주되지 않으며, 트레이딩뷰에서 제공하거나 보증하는 것이 아닙니다. 자세한 내용은 이용 약관을 참조하세요.
오픈 소스 스크립트
트레이딩뷰의 진정한 정신에 따라, 이 스크립트의 작성자는 이를 오픈소스로 공개하여 트레이더들이 기능을 검토하고 검증할 수 있도록 했습니다. 작성자에게 찬사를 보냅니다! 이 코드는 무료로 사용할 수 있지만, 코드를 재게시하는 경우 하우스 룰이 적용된다는 점을 기억하세요.
Plan the trade ⚡ Trade the plan
면책사항
해당 정보와 게시물은 금융, 투자, 트레이딩 또는 기타 유형의 조언이나 권장 사항으로 간주되지 않으며, 트레이딩뷰에서 제공하거나 보증하는 것이 아닙니다. 자세한 내용은 이용 약관을 참조하세요.