OPEN-SOURCE SCRIPT
업데이트됨 ACTION Locator
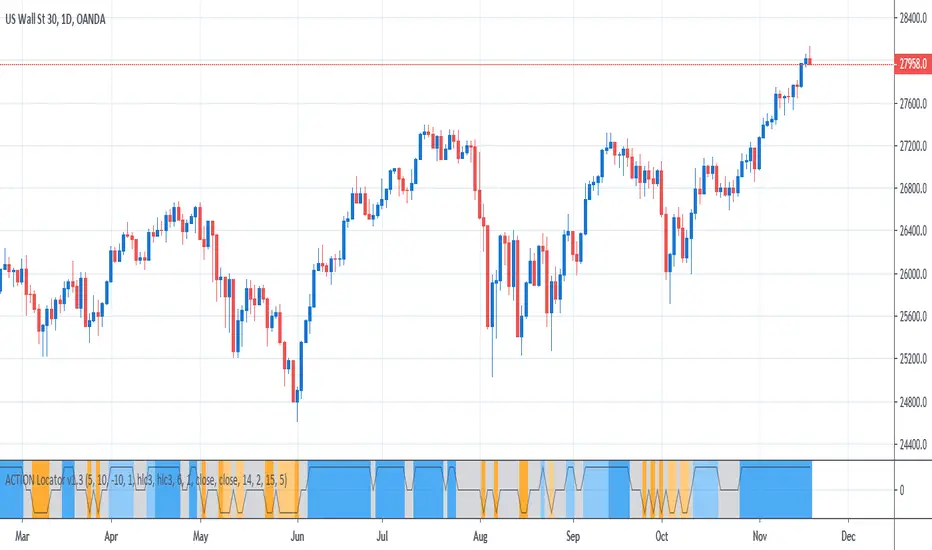
The indicator is based on the RSI and the Absolute Strength Histogram (more specifically the modification by Jie).
It is meant to be used to filter out periods of consolidation, and determine if the bulls or bears are in control when there is enough action to possibly start a trend.
The RSI is not used to find overbought or oversold conditions, but to find momentum and filter out sideways movement.
The ASH is used to filter out sideways movement by looking at the difference between the bulls and the bears and when the difference is below either the bulls or the bears, the market is considered to be consolidating. Otherwise, direction for possible trends are determined by which line is above the other.
Blue background = Bulls are in control of the ACTION
Orange background = Bears are in control of the ACTION
Gray background = No ACTION - DO NOT TRADE
릴리즈 노트
Version 1.1- Added bypass options for the RSI, the ASH and the F**k U Candle ATR filter.
- The upper and lower thresholds for the RSI work for quantized RSI values now as well.
릴리즈 노트
- Version 1.2 -- Added Signal Reliability Filter.
- If turned on, it detects a max amount of signal changes in a lookback period to see if we can continue to rely on the signals. If more signal changes happen than we allow, it turns the color transparent, to warn about weak signals being produced. One could choose to either stay away from trading until the color turns solid again, or trade at half the risk.
- Changed ASH to bypassed by default as the main thing is the RSI anyway.
- Changed default settings to Quantized values for the RSI and Heikin Ashi as input, as well as the period to use for the RSI to 5. It has proven more reliable.
릴리즈 노트
Version 1.3- Fixed a bug that made bypassing the RSI impossible.
오픈 소스 스크립트
트레이딩뷰의 진정한 정신에 따라, 이 스크립트의 작성자는 이를 오픈소스로 공개하여 트레이더들이 기능을 검토하고 검증할 수 있도록 했습니다. 작성자에게 찬사를 보냅니다! 이 코드는 무료로 사용할 수 있지만, 코드를 재게시하는 경우 하우스 룰이 적용된다는 점을 기억하세요.
면책사항
해당 정보와 게시물은 금융, 투자, 트레이딩 또는 기타 유형의 조언이나 권장 사항으로 간주되지 않으며, 트레이딩뷰에서 제공하거나 보증하는 것이 아닙니다. 자세한 내용은 이용 약관을 참조하세요.
오픈 소스 스크립트
트레이딩뷰의 진정한 정신에 따라, 이 스크립트의 작성자는 이를 오픈소스로 공개하여 트레이더들이 기능을 검토하고 검증할 수 있도록 했습니다. 작성자에게 찬사를 보냅니다! 이 코드는 무료로 사용할 수 있지만, 코드를 재게시하는 경우 하우스 룰이 적용된다는 점을 기억하세요.
면책사항
해당 정보와 게시물은 금융, 투자, 트레이딩 또는 기타 유형의 조언이나 권장 사항으로 간주되지 않으며, 트레이딩뷰에서 제공하거나 보증하는 것이 아닙니다. 자세한 내용은 이용 약관을 참조하세요.