OPEN-SOURCE SCRIPT
Candilator RSI [AstrideUnicorn]
OVERVIEW
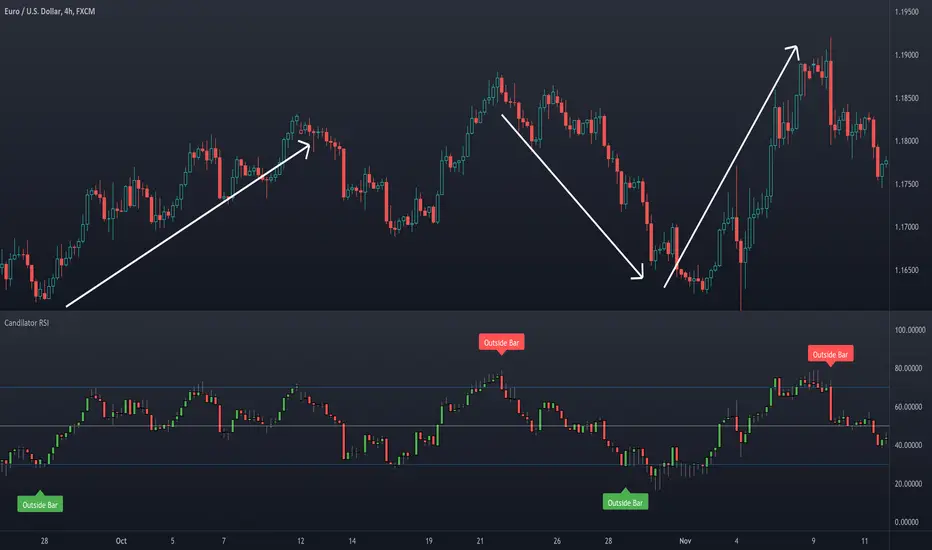
The name Candilator comes from blending the words "candlestick" and "oscillator". And as the name suggests, this indicator is a good old RSI plotted as a candlestick chart. To produce a candlestick chart, Candilator RSI calculates four RSI's based on the open, high, low, and close time series. It also has a candlestick patterns detection feature.
HOW TO USE
You can use Candilator RSI as a normal RSI to analyze momentum, detect overbought and oversold markets, and find the oscillator's divergences with the price. You can also get creative and apply all sorts of technical analysis to the RSI candlestick chart, including candlestick patterns analysis.
Candilator RSI can automatically scan the price for some candlestick patterns in the overbought and oversold zones. This feature can help detect price reversals early.
SETTINGS
The indicator settings are divided into two groups: Main Settings and Pattern Detection. In the Main Settings, you can find standard RSI settings. In the Pattern Detection part, you can turn on and off the automatic search for a particular candlestick pattern.
오픈 소스 스크립트
트레이딩뷰의 진정한 정신에 따라, 이 스크립트의 작성자는 이를 오픈소스로 공개하여 트레이더들이 기능을 검토하고 검증할 수 있도록 했습니다. 작성자에게 찬사를 보냅니다! 이 코드는 무료로 사용할 수 있지만, 코드를 재게시하는 경우 하우스 룰이 적용된다는 점을 기억하세요.
Our premium trading indicators: unicorn.trading
Join our Discord community: dsc.gg/unicom
Join our Discord community: dsc.gg/unicom
면책사항
해당 정보와 게시물은 금융, 투자, 트레이딩 또는 기타 유형의 조언이나 권장 사항으로 간주되지 않으며, 트레이딩뷰에서 제공하거나 보증하는 것이 아닙니다. 자세한 내용은 이용 약관을 참조하세요.