PROTECTED SOURCE SCRIPT
BASED Momentum Oscillator
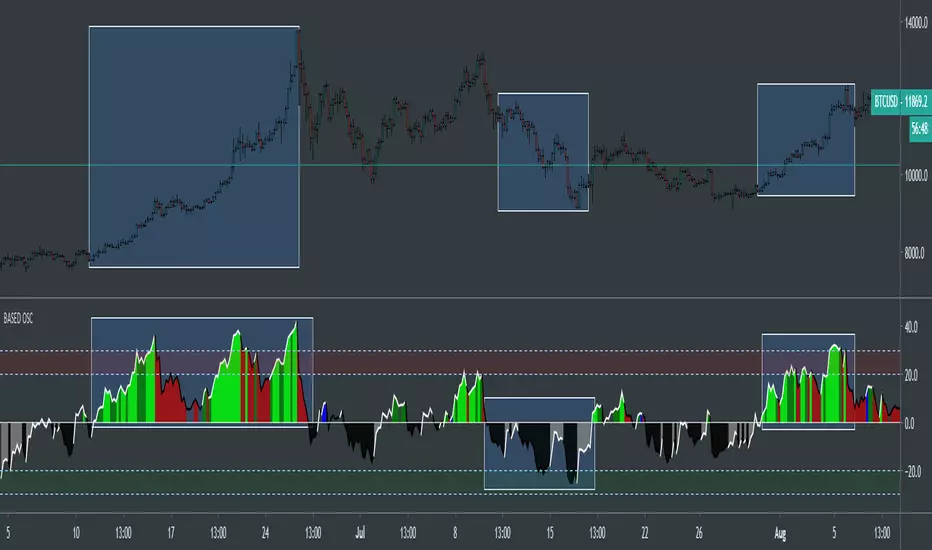
This is the BASED Momentum Oscillator. I have been working on this for awhile and it's been working really great! Can be used on any security on any timeframe. Spot entries during a bullish or bearish trend, oversold and overbought conditions, can be used to spot divergences.
When the oscillator reaches the red area on top, it means the security is entering overbought conditions. When the oscillator reaches the green area at bottom, it means the security is entering oversold conditions.
Lime = Strong uptrend
Green = Uptrend
Blue = Neutral uptrend
Red = Declining uptrend
Black = Bearish decline
Grey = Cautious recovery from Bearish decline
Blank Area = no signal
Should be used with two more indicators for confirmation.
Enjoy!
보호된 스크립트입니다
이 스크립트는 비공개 소스로 게시됩니다. 하지만 이를 자유롭게 제한 없이 사용할 수 있습니다 – 자세한 내용은 여기에서 확인하세요.
면책사항
해당 정보와 게시물은 금융, 투자, 트레이딩 또는 기타 유형의 조언이나 권장 사항으로 간주되지 않으며, 트레이딩뷰에서 제공하거나 보증하는 것이 아닙니다. 자세한 내용은 이용 약관을 참조하세요.
보호된 스크립트입니다
이 스크립트는 비공개 소스로 게시됩니다. 하지만 이를 자유롭게 제한 없이 사용할 수 있습니다 – 자세한 내용은 여기에서 확인하세요.
면책사항
해당 정보와 게시물은 금융, 투자, 트레이딩 또는 기타 유형의 조언이나 권장 사항으로 간주되지 않으며, 트레이딩뷰에서 제공하거나 보증하는 것이 아닙니다. 자세한 내용은 이용 약관을 참조하세요.