INVITE-ONLY SCRIPT
업데이트됨 TradeWiserBE_V1
Price and Volume are the significant drivers in the market. They both come along to create supply and demand. As a trader, we should be knowing when the price levels on charts that tend to act as barriers, preventing the price from getting pushed in a certain direction.
It's often difficult to spot them with the eyes when you are typically new to the trading world. Hence this indicator came in handy. The indicator helps you to plot the key support and resistance areas on the chart which will guide you in making informed trades wiser.
Sometimes prices shoot however it may not have the significant volume to support the movement, basically faking the levels to trap traders, this indicator should help you in identifying those momentum candles. Have used moving averages and certain levels of volume spikes to identify and spot the candle strength.
Traders may also trade the diverges between momentum and the price vs volume. Helps you to spot the pure divergences and plots them on the chart.
wondering why after a certain level of price stretch during the day trading, it tends to act crazy, and all the price action strategy fails even after multiple confirmations. The majority of traders including self fail to read the chart the proper way. Hence it made me develop this indicator so that I can be sure of what is happening on the chart. ATR is used to calculate the plot the same.
If you are an options trader you may also use this indicator as a guide in order to estimate how much an option price would move at each level. Mathematical calculations are being used in order to arrive at the estimated option values.
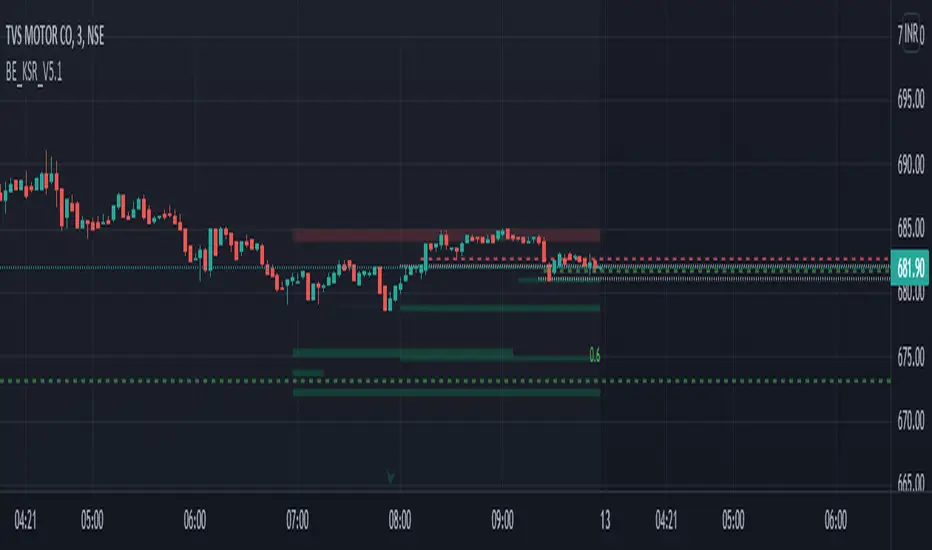
This is a typical price action indicator plotting the key support and resistance on the timeframe traded
What it can do?
1. Early signs of reversal
2. helps you to decide when to enter and exit.
3. Day Range.
4. Option price estimates.
What calculations consist of?
1. ATR
2. Price stop and move points.
3. BBP
4. Averages
5. Mathematical calculations.
It's often difficult to spot them with the eyes when you are typically new to the trading world. Hence this indicator came in handy. The indicator helps you to plot the key support and resistance areas on the chart which will guide you in making informed trades wiser.
Sometimes prices shoot however it may not have the significant volume to support the movement, basically faking the levels to trap traders, this indicator should help you in identifying those momentum candles. Have used moving averages and certain levels of volume spikes to identify and spot the candle strength.
Traders may also trade the diverges between momentum and the price vs volume. Helps you to spot the pure divergences and plots them on the chart.
wondering why after a certain level of price stretch during the day trading, it tends to act crazy, and all the price action strategy fails even after multiple confirmations. The majority of traders including self fail to read the chart the proper way. Hence it made me develop this indicator so that I can be sure of what is happening on the chart. ATR is used to calculate the plot the same.
If you are an options trader you may also use this indicator as a guide in order to estimate how much an option price would move at each level. Mathematical calculations are being used in order to arrive at the estimated option values.
This is a typical price action indicator plotting the key support and resistance on the timeframe traded
What it can do?
1. Early signs of reversal
2. helps you to decide when to enter and exit.
3. Day Range.
4. Option price estimates.
What calculations consist of?
1. ATR
2. Price stop and move points.
3. BBP
4. Averages
5. Mathematical calculations.
릴리즈 노트
Couple of Updated done to the script. Below are the Outcome in this version of Script1. Bug Fixed in Pullback Line : Removed the Extra Un-Necessary Lines which was all over the chart
2. Bug Fixed : Users may have the option to check or uncheck to see the (Major) Key Buyers | Seller Price Line (Red | Green Dotted Lines)
3. Option Added: Regular Fibonaaci levels.
Plz do PM me for further questions if you have.
릴리즈 노트
Only Bug Fixes. Improved some calculations.릴리즈 노트
Updated to V5 - Given an option to choose other price & momentum related technical indicator along with MACD to spot the divergence.
릴리즈 노트
Bug Fixed. No Major Update릴리즈 노트
Added Fibonacci Channel to the indicator. Channel Trading has been giving a good amount of fruitful trade setups and its quite easy to trade the same, considering the risk to reward ratio it provides. Long Fibo channel usually do not slope downwards and vise-versa for Short Fibo Channel. It requires couple of considerations to be made before concluding the valid trade setup like. No of candles it took to form a Triangle, angle of the triangle (LL to HL for long setup & HH to LH for short setup)
With all these factors, options have been provided to the users of this indicator to filter out the respective setups.
1. Strong Channel (Lesser No of Candles Involved to form a triangle & the angle is co-ordinates defining the Strength)
2. Slightly Strong Channel (Similar to Strong with couple of Error Rate)
3. Weak Channel (Higher No of Candles Involved to form a triangle & the volatility is to slow due to its consolidation)
4. High Volatile Channel (Triangles having Higher volatility)
Couple of customizable options like setting the Target points, Colors and SL Range have been provided accordingly.
릴리즈 노트
Fixed the bug of 0 index too long to plot.초대 전용 스크립트
이 스크립트는 작성자가 승인한 사용자만 접근할 수 있습니다. 사용하려면 요청 후 승인을 받아야 하며, 일반적으로 결제 후에 허가가 부여됩니다. 자세한 내용은 아래 작성자의 안내를 따르거나 TradeWiseWithEase에게 직접 문의하세요.
트레이딩뷰는 스크립트의 작동 방식을 충분히 이해하고 작성자를 완전히 신뢰하지 않는 이상, 해당 스크립트에 비용을 지불하거나 사용하는 것을 권장하지 않습니다. 커뮤니티 스크립트에서 무료 오픈소스 대안을 찾아보실 수도 있습니다.
작성자 지시 사항
PM me on TV to request for access
TRADING MADE SIMPLE
면책사항
해당 정보와 게시물은 금융, 투자, 트레이딩 또는 기타 유형의 조언이나 권장 사항으로 간주되지 않으며, 트레이딩뷰에서 제공하거나 보증하는 것이 아닙니다. 자세한 내용은 이용 약관을 참조하세요.
초대 전용 스크립트
이 스크립트는 작성자가 승인한 사용자만 접근할 수 있습니다. 사용하려면 요청 후 승인을 받아야 하며, 일반적으로 결제 후에 허가가 부여됩니다. 자세한 내용은 아래 작성자의 안내를 따르거나 TradeWiseWithEase에게 직접 문의하세요.
트레이딩뷰는 스크립트의 작동 방식을 충분히 이해하고 작성자를 완전히 신뢰하지 않는 이상, 해당 스크립트에 비용을 지불하거나 사용하는 것을 권장하지 않습니다. 커뮤니티 스크립트에서 무료 오픈소스 대안을 찾아보실 수도 있습니다.
작성자 지시 사항
PM me on TV to request for access
TRADING MADE SIMPLE
면책사항
해당 정보와 게시물은 금융, 투자, 트레이딩 또는 기타 유형의 조언이나 권장 사항으로 간주되지 않으며, 트레이딩뷰에서 제공하거나 보증하는 것이 아닙니다. 자세한 내용은 이용 약관을 참조하세요.