INVITE-ONLY SCRIPT
업데이트됨 ds Revenue, Margins, Earnings Trends
PURPOSE: Looks for trends in Revenue, Margins, Earnings (RME) and provides a quick indication of where to focus your attention. Developed for educational purposes for my Investing Program Students at Everett Community College, Everett, WA.
WHAT IT DOES:
Based on the principle that fundamental trends support technical price trends this indicator intends to help swing and position trading students evaluate the income statement by exposing recent trends in the revenue, margins, and earnings looking at eight quarters of data. It requires three quarters to determine a trend therefore there is a heavy focus on the last three quarters of data. Tools and indicators should be used to "tell something useful" in this case it is specifically is revenue, margins, and earnings expanding, contracting, or flat? Is this movement accelerating or decelerating? Lastly some logic is used to interpret at glance whether this stock warrants a closer look into the fundamentals and technicals of this particular company.
HOW TO:
This is a brief description on how to use this tool
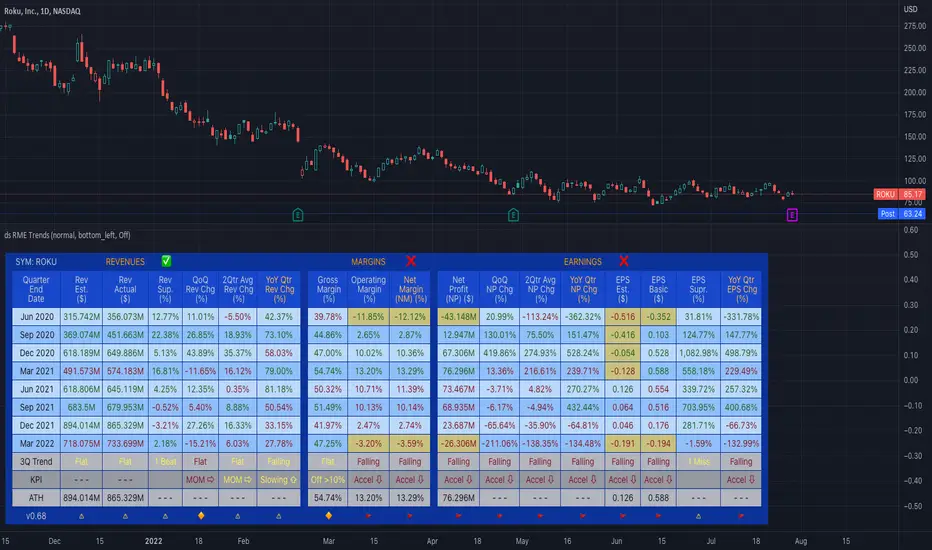
1. TOP ROW: This shows the symbol and then provides a summation indicator (Green Checkmark, Yellow caution triangle, Red X) for each section (Revenue, Margins, Earnings). At a glance shows strength/weakness/concerns.
2. TABLE: You will see 8 quarters of data assuming it is available broken into sections for Revenue, Margins, and Earnings.
3. COLUMNS: The text color red does not denote a negative number and the text color green does not denote a positive number. Rather in the column of data where it is displayed, the green text helps visually show a bullish trend when each value is greater than the prior value and the red text helps visually show a bearish trend when each value is less than the prior value. Yellow background in columns highlights values which should not normally be negative numbers.
4. 3Q TREND ROW: This row analyzes the last three quarters of data in the column to determine if the trend is rising, falling, or flat.
5. 3Q ROCK ROW: This row analyzes the last three quarters of data to determine if the trend is accelerating up, accelerating down, or momentum (MOM) is sideways.
6. BOTTOM ROW INDICATORS: Based on whether the numbers are negative or positive and the trend, This row shows one of the following results:
6a. Green Checkmark is considered acceptable performance.
6b. Yellow Caution Triangle indicates a closer inspection of this columns data is warranted.
6c. Orange Diamond is more serious than the Caution but not as bad as a Red Flag. Extra caution is required here.
6d. Red Flag indicates a warning that undesirable performance characteristics are associated with the data in this column.
WHAT IT DOES:
Based on the principle that fundamental trends support technical price trends this indicator intends to help swing and position trading students evaluate the income statement by exposing recent trends in the revenue, margins, and earnings looking at eight quarters of data. It requires three quarters to determine a trend therefore there is a heavy focus on the last three quarters of data. Tools and indicators should be used to "tell something useful" in this case it is specifically is revenue, margins, and earnings expanding, contracting, or flat? Is this movement accelerating or decelerating? Lastly some logic is used to interpret at glance whether this stock warrants a closer look into the fundamentals and technicals of this particular company.
HOW TO:
This is a brief description on how to use this tool
1. TOP ROW: This shows the symbol and then provides a summation indicator (Green Checkmark, Yellow caution triangle, Red X) for each section (Revenue, Margins, Earnings). At a glance shows strength/weakness/concerns.
2. TABLE: You will see 8 quarters of data assuming it is available broken into sections for Revenue, Margins, and Earnings.
3. COLUMNS: The text color red does not denote a negative number and the text color green does not denote a positive number. Rather in the column of data where it is displayed, the green text helps visually show a bullish trend when each value is greater than the prior value and the red text helps visually show a bearish trend when each value is less than the prior value. Yellow background in columns highlights values which should not normally be negative numbers.
4. 3Q TREND ROW: This row analyzes the last three quarters of data in the column to determine if the trend is rising, falling, or flat.
5. 3Q ROCK ROW: This row analyzes the last three quarters of data to determine if the trend is accelerating up, accelerating down, or momentum (MOM) is sideways.
6. BOTTOM ROW INDICATORS: Based on whether the numbers are negative or positive and the trend, This row shows one of the following results:
6a. Green Checkmark is considered acceptable performance.
6b. Yellow Caution Triangle indicates a closer inspection of this columns data is warranted.
6c. Orange Diamond is more serious than the Caution but not as bad as a Red Flag. Extra caution is required here.
6d. Red Flag indicates a warning that undesirable performance characteristics are associated with the data in this column.
릴리즈 노트
Update to script version 0.48- added script version on bottom left of table
- REVENUES TOP ROW: green checkmark revenues condition when all looks reasonable and YoY ROC is flat but >= 20%
- MARGINS TOP ROW: green checkmark margin condition when margins are flat but at acceptable levels (gm_flat, om_flat, nm_flat and most recent quarters margins are gm >= 50%, om >=30%, nm >=25%)
릴리즈 노트
update Chart릴리즈 노트
v0.50 minor tweaks릴리즈 노트
This incorporates a number of improvements including adding a row for All-Time-High (ATH) to get perspective. This is still a pre-beta type release v0.66 with more important updates coming soon. -ds-릴리즈 노트
This update (still a beta release) v0.67 starts to incorporate tooltips for column headers (more to be added soon). Also adds status line that will provide both All-Time-High (ATH) and report All-Time-Low (ATL) should that condition be observed in the most recent report. Additional fine tuning to incorporate analysis logic. Many more enhancements coming soon. -ds-릴리즈 노트
This is still a beta version and includes some minor fixes. This still contains a known bug where it sometimes does not display some data analysis for certain stocks . A more significant update is planned for the near future and features will be more clearly documents. 초대 전용 스크립트
이 스크립트는 작성자가 승인한 사용자만 접근할 수 있습니다. 사용하려면 요청 후 승인을 받아야 하며, 일반적으로 결제 후에 허가가 부여됩니다. 자세한 내용은 아래 작성자의 안내를 따르거나 darrels에게 직접 문의하세요.
트레이딩뷰는 스크립트의 작동 방식을 충분히 이해하고 작성자를 완전히 신뢰하지 않는 이상, 해당 스크립트에 비용을 지불하거나 사용하는 것을 권장하지 않습니다. 커뮤니티 스크립트에서 무료 오픈소스 대안을 찾아보실 수도 있습니다.
작성자 지시 사항
This was developed for educational purposes for my Investing Program Students at Everett Community College, Everett, WA.
But I am open to sharing it with others and you may contact me privately if you wish to be invited to use it.
면책사항
해당 정보와 게시물은 금융, 투자, 트레이딩 또는 기타 유형의 조언이나 권장 사항으로 간주되지 않으며, 트레이딩뷰에서 제공하거나 보증하는 것이 아닙니다. 자세한 내용은 이용 약관을 참조하세요.
초대 전용 스크립트
이 스크립트는 작성자가 승인한 사용자만 접근할 수 있습니다. 사용하려면 요청 후 승인을 받아야 하며, 일반적으로 결제 후에 허가가 부여됩니다. 자세한 내용은 아래 작성자의 안내를 따르거나 darrels에게 직접 문의하세요.
트레이딩뷰는 스크립트의 작동 방식을 충분히 이해하고 작성자를 완전히 신뢰하지 않는 이상, 해당 스크립트에 비용을 지불하거나 사용하는 것을 권장하지 않습니다. 커뮤니티 스크립트에서 무료 오픈소스 대안을 찾아보실 수도 있습니다.
작성자 지시 사항
This was developed for educational purposes for my Investing Program Students at Everett Community College, Everett, WA.
But I am open to sharing it with others and you may contact me privately if you wish to be invited to use it.
면책사항
해당 정보와 게시물은 금융, 투자, 트레이딩 또는 기타 유형의 조언이나 권장 사항으로 간주되지 않으며, 트레이딩뷰에서 제공하거나 보증하는 것이 아닙니다. 자세한 내용은 이용 약관을 참조하세요.