OPEN-SOURCE SCRIPT
업데이트됨 VWMA/SMA Delta Volatility (Statistical Anomaly Detector)
The "VWMA/SMA Delta Volatility (Statistical Anomaly Detector)" indicator is a tool designed to detect and visualize volatility in a financial market's price data. The indicator calculates the difference (delta) between two moving averages (VWMA/SMA) and uses statistical analysis to identify anomalies or extreme price movements. Here's a breakdown of its components:
Hypothesis:
The hypothesis behind this indicator is that extreme price movements or anomalies in the market can be detected by analyzing the difference between two moving averages and comparing it to a statistically derived normal distribution. When the MA delta (the difference between two MAs: VWMA/SMA) exceeds a certain threshold based on standard deviation and the Z-score coefficient, it may indicate increased market volatility or potential trading opportunities.
Calculation of MA Delta:
The indicator calculates the MA delta by subtracting a simple moving average (SMA) from a volume-weighted moving average (VWMA) of a selected price source. This calculation represents the difference in the market's short-term and long-term trends.
Statistical Analysis:
To detect anomalies, the indicator performs statistical analysis on the MA delta. It calculates a moving average (MA) of the MA delta and its standard deviation over a specified sample size. This MA acts as a baseline, and the standard deviation is used to measure how much the MA delta deviates from the mean.
Delta Normalization:
The MA delta, lower filter, and upper filter are normalized using a function that scales them to a specific range, typically from -100 to 100. Normalization helps in comparing these values on a consistent scale and enhances their visual representation.
Visual Representation:
The indicator visualizes the results through histograms and channels:
In summary, the "MA Delta Volatility (Statistical Anomaly Detector)" indicator aims to help traders identify abnormal price movements in the market by analyzing the difference between two moving averages and applying statistical measures. It can be a valuable tool for traders looking to spot potential opportunities during periods of increased volatility or to identify potential market anomalies.
Hypothesis:
The hypothesis behind this indicator is that extreme price movements or anomalies in the market can be detected by analyzing the difference between two moving averages and comparing it to a statistically derived normal distribution. When the MA delta (the difference between two MAs: VWMA/SMA) exceeds a certain threshold based on standard deviation and the Z-score coefficient, it may indicate increased market volatility or potential trading opportunities.
Calculation of MA Delta:
The indicator calculates the MA delta by subtracting a simple moving average (SMA) from a volume-weighted moving average (VWMA) of a selected price source. This calculation represents the difference in the market's short-term and long-term trends.
Statistical Analysis:
To detect anomalies, the indicator performs statistical analysis on the MA delta. It calculates a moving average (MA) of the MA delta and its standard deviation over a specified sample size. This MA acts as a baseline, and the standard deviation is used to measure how much the MA delta deviates from the mean.
Delta Normalization:
The MA delta, lower filter, and upper filter are normalized using a function that scales them to a specific range, typically from -100 to 100. Normalization helps in comparing these values on a consistent scale and enhances their visual representation.
Visual Representation:
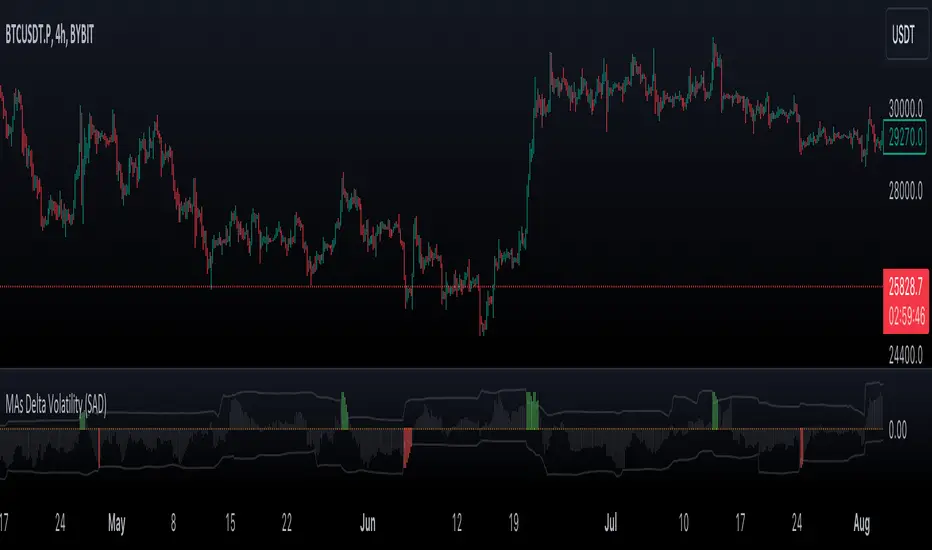
The indicator visualizes the results through histograms and channels:
- The histogram bars represent the normalized MA delta. Red bars indicate negative and below-lower-filter values, green bars indicate positive and above-upper-filter values, and silver bars indicate values within the normal range.
- It also displays a Z-score channel, which represents the upper and lower filters after normalization. This channel helps traders identify price levels that are statistically significant and potentially indicative of market volatility.
In summary, the "MA Delta Volatility (Statistical Anomaly Detector)" indicator aims to help traders identify abnormal price movements in the market by analyzing the difference between two moving averages and applying statistical measures. It can be a valuable tool for traders looking to spot potential opportunities during periods of increased volatility or to identify potential market anomalies.
릴리즈 노트
Code refactor릴리즈 노트
Enhanced the robustness of the normalization function.릴리즈 노트
Incorporated an indicator description as comments within the code to provide better context and understanding릴리즈 노트
refactor: upgrade to v6, modularize with types and methods, improve normalization and configuration structure:- Pine Script version upgrade
- Modular structure (Settings, Results)
- Clearer configuration inputs
- Improved normalization logic via calcNormalized method
오픈 소스 스크립트
트레이딩뷰의 진정한 정신에 따라, 이 스크립트의 작성자는 이를 오픈소스로 공개하여 트레이더들이 기능을 검토하고 검증할 수 있도록 했습니다. 작성자에게 찬사를 보냅니다! 이 코드는 무료로 사용할 수 있지만, 코드를 재게시하는 경우 하우스 룰이 적용된다는 점을 기억하세요.
면책사항
해당 정보와 게시물은 금융, 투자, 트레이딩 또는 기타 유형의 조언이나 권장 사항으로 간주되지 않으며, 트레이딩뷰에서 제공하거나 보증하는 것이 아닙니다. 자세한 내용은 이용 약관을 참조하세요.
오픈 소스 스크립트
트레이딩뷰의 진정한 정신에 따라, 이 스크립트의 작성자는 이를 오픈소스로 공개하여 트레이더들이 기능을 검토하고 검증할 수 있도록 했습니다. 작성자에게 찬사를 보냅니다! 이 코드는 무료로 사용할 수 있지만, 코드를 재게시하는 경우 하우스 룰이 적용된다는 점을 기억하세요.
면책사항
해당 정보와 게시물은 금융, 투자, 트레이딩 또는 기타 유형의 조언이나 권장 사항으로 간주되지 않으며, 트레이딩뷰에서 제공하거나 보증하는 것이 아닙니다. 자세한 내용은 이용 약관을 참조하세요.