INVITE-ONLY SCRIPT
업데이트됨 Options Flow Intraday Sentiment
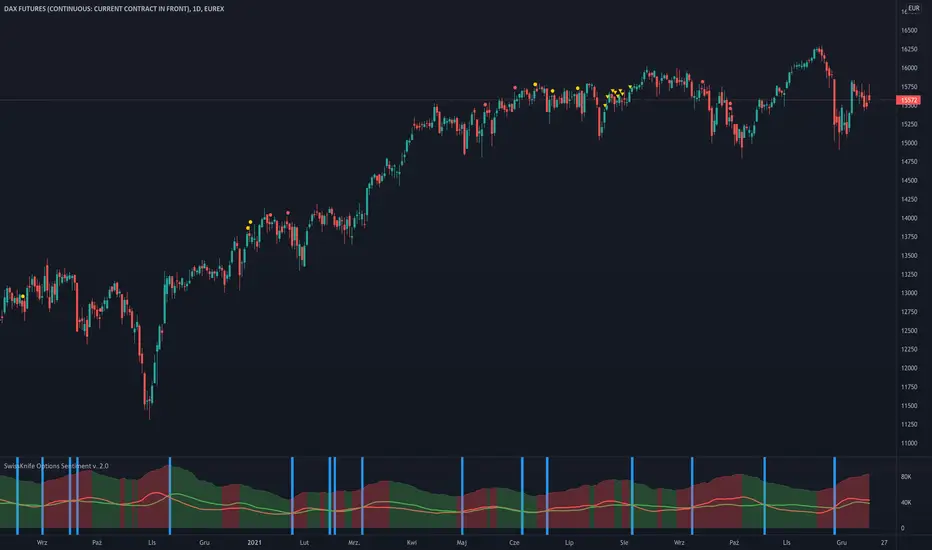
Script useful for Intraday Trading - which based on Options data loaded in background - is showing sentiment of Investors. Very often Options are forecasting and precedes moves that will happen later on derivatives like Futures Contracts. Due to its' nature, data is useful during Regular Trading Hours sessions ( RTH ).
We take into account Options Volume flow & Put/Call Ratio from Options. Data is based from dataset on Quandl and loaded to TradingView. Therefore data is normalized as per different factors we have different scale of received data. Then I apply calculations comparing PUT and CALL Volume, giving the biggest weight ratio to those Options which have nearest Expiration Date. Another condition taken into account is Type of Option: either In the Money, Out of Money or At the money. Last but not least for Options there is calculated risk, where those orderflow entries with lowest risk are having the biggest weight in calculation while those with highest risk - are having lower ratio. Risk is calculated based on delta factor (coming out of Options standard definitions).
Background of indicator is coloured in direction of sentiment when we have alignment of sentiment factors calculated in background in one direction. Script is displaying additionally PUT Volume, CALL Volume from Options and PUT/CALL Ratio. Those are only additional information that can be useful for traders, but the whole logic is hidden under the hood (as described earlier) and is showing coloured background when sentiment is aligned. Therefore be prepared to take potentially a trade in direction of the background - but not blindly
Currently it's supporting SPX ( S&P500 ) and support for more instruments will come with next updates.
릴리즈 노트
- added display and calculation of Balance Points - where Supply and Demand are balanced/equal based on the data from PUTs and CALLs read from Quandl dataset
- changed display of leading side on the market - green area represents dominating Bulls while Red - Bears
- script is now universally selecting in the background source of Options data based on instrument & chart on which it's placed; in case of unsupported instrument no data will appear
- script works best on D1 timeframe (due to changed logic of calculation Options data and its' ratios)
릴리즈 노트
- added new display mode to display difference histogram between Supply and Demand instead of default view of Moving Average Lines
- Orange histogram shows dominance of Supply (Bearish Market) and Blue one represents dominance of Demand (Bullish Market)
릴리즈 노트
- added alerts when Volume Flow switch from/to Bullish/Bearish
- modified visualisation of net difference between Volume of PUT and CALL Options
초대 전용 스크립트
이 스크립트는 작성자가 승인한 사용자만 접근할 수 있습니다. 사용하려면 요청 후 승인을 받아야 하며, 일반적으로 결제 후에 허가가 부여됩니다. 자세한 내용은 아래 작성자의 안내를 따르거나 skyline-trader에게 직접 문의하세요.
트레이딩뷰는 스크립트의 작동 방식을 충분히 이해하고 작성자를 완전히 신뢰하지 않는 이상, 해당 스크립트에 비용을 지불하거나 사용하는 것을 권장하지 않습니다. 커뮤니티 스크립트에서 무료 오픈소스 대안을 찾아보실 수도 있습니다.
작성자 지시 사항
면책사항
해당 정보와 게시물은 금융, 투자, 트레이딩 또는 기타 유형의 조언이나 권장 사항으로 간주되지 않으며, 트레이딩뷰에서 제공하거나 보증하는 것이 아닙니다. 자세한 내용은 이용 약관을 참조하세요.