PROTECTED SOURCE SCRIPT
FHX Bands (VWMA BB)
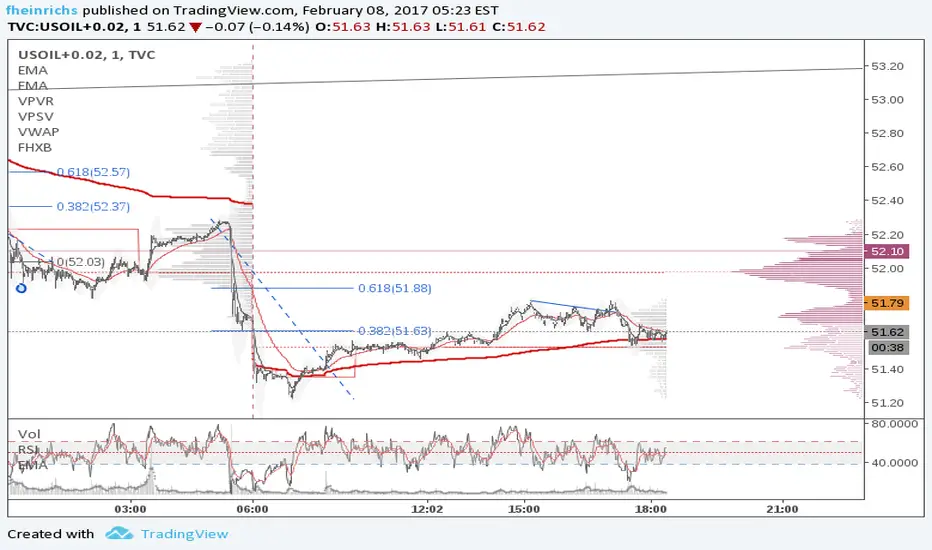
This study is an optimized version of Bollinger Bands based on volume weighted data points: more volume on a bar gives those prices a higher impact. FHX bands base on the assumptions of auction market theory (e.g., as does volume profiling). Bollinger Bands implicitly assume a uniform probability mass function for data points and consider only the - somewhat arbitrary - close price. In contrast to this, FHX bands take all four available data points into account (OHLC) and use the volume at each candle* to define a probability mass function in order to compute mean and standard deviation.
As an indicator, FHX bands could be used in the same way as BB to facilitate or confirm Break-Out trades and identify strong momentum moves. Settings for the standard deviation multiplier should be interpreted as follows (following the 68–95–99.7 rule):
This however assumes a fairly solid period of consolidation beforehand (visible through notable contraction of the bands) and a normal distribution of values within that consolidation period. Therefore users need to experiment within their time frame in order to identify a Length setting that suits their needs. Personally, I set Length to 21 or lower, depending on my targeted time frame. Note that the indicator does not test for normality in any way; you can, however, use a quick visual test using the fixed range volume profile indicator to increase its reliability.
Good luck and mind your risk
-fhx
* of course tick data would be the real deal, but we work with what we have
As an indicator, FHX bands could be used in the same way as BB to facilitate or confirm Break-Out trades and identify strong momentum moves. Settings for the standard deviation multiplier should be interpreted as follows (following the 68–95–99.7 rule):
- x standard deviation set to 1: ~32% chance that a move outside the bands is by chance
- x standard deviation set to 2: ~5% chance that a move outside the bands is by chance
- x standard deviation set to 3: ~0.3% chance that a move outside the bands is by chance
This however assumes a fairly solid period of consolidation beforehand (visible through notable contraction of the bands) and a normal distribution of values within that consolidation period. Therefore users need to experiment within their time frame in order to identify a Length setting that suits their needs. Personally, I set Length to 21 or lower, depending on my targeted time frame. Note that the indicator does not test for normality in any way; you can, however, use a quick visual test using the fixed range volume profile indicator to increase its reliability.
Good luck and mind your risk
-fhx
* of course tick data would be the real deal, but we work with what we have
보호된 스크립트입니다
이 스크립트는 비공개 소스로 게시됩니다. 하지만 이를 자유롭게 제한 없이 사용할 수 있습니다 – 자세한 내용은 여기에서 확인하세요.
면책사항
해당 정보와 게시물은 금융, 투자, 트레이딩 또는 기타 유형의 조언이나 권장 사항으로 간주되지 않으며, 트레이딩뷰에서 제공하거나 보증하는 것이 아닙니다. 자세한 내용은 이용 약관을 참조하세요.
보호된 스크립트입니다
이 스크립트는 비공개 소스로 게시됩니다. 하지만 이를 자유롭게 제한 없이 사용할 수 있습니다 – 자세한 내용은 여기에서 확인하세요.
면책사항
해당 정보와 게시물은 금융, 투자, 트레이딩 또는 기타 유형의 조언이나 권장 사항으로 간주되지 않으며, 트레이딩뷰에서 제공하거나 보증하는 것이 아닙니다. 자세한 내용은 이용 약관을 참조하세요.