OPEN-SOURCE SCRIPT
업데이트됨 DJ Soori Trading Strategy

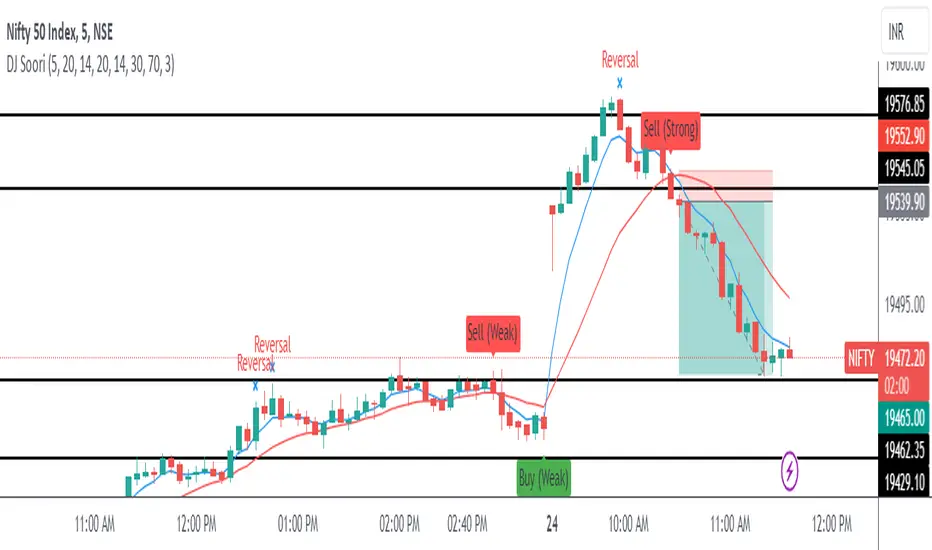
The strategy combines three indicators: Exponential Moving Average (EMA), Weighted Moving Average (WMA), and Average Directional Index (ADX).
The EMA and WMA are used to track the average price over different time periods.
The ADX measures the strength of a trend in the market.
The strategy generates buy signals when the EMA is higher than the WMA and the ADX is above a certain threshold. It suggests a potential uptrend.
It generates sell signals when the EMA is lower than the WMA and the ADX is above the threshold. It suggests a potential downtrend.
The strategy also considers whether the ADX is rising or falling to indicate the strength of the trend.
The EMA, WMA, and ADX values are plotted on the chart.
Buy and sell signals are shown as labels on the chart, indicating "Buy (Strong)" or "Buy (Weak)" for buy signals, and "Sell (Strong)" or "Sell (Weak)" for sell signals.
릴리즈 노트
The strategy combines three indicators: Exponential Moving Average (EMA), Weighted Moving Average (WMA), and Average Directional Index (ADX).EMA and WMA track the average price over different time periods.
ADX measures the strength of a trend in the market.
Buy signals:
Generated when EMA is higher than WMA and ADX is above a threshold.
Indicates a potential uptrend.
Sell signals:
Generated when EMA is lower than WMA and ADX is above the threshold.
Indicates a potential downtrend.
The strategy considers the rising or falling nature of ADX to assess the strength of the trend.
The chart displays the EMA, WMA, and ADX values.
Buy and sell signals are indicated on the chart as labels:
"Buy (Strong)" or "Buy (Weak)" for buy signals.
"Sell (Strong)" or "Sell (Weak)" for sell signals.
This strategy helps identify potential trends and provides buy/sell signals based on the EMA-WMA crossover and ADX strength.
릴리즈 노트
Updated barstate codes 릴리즈 노트
Book profit has been changed to reversal sign릴리즈 노트
Some new changes added 릴리즈 노트
Updated EMA and WMA오픈 소스 스크립트
트레이딩뷰의 진정한 정신에 따라, 이 스크립트의 작성자는 이를 오픈소스로 공개하여 트레이더들이 기능을 검토하고 검증할 수 있도록 했습니다. 작성자에게 찬사를 보냅니다! 이 코드는 무료로 사용할 수 있지만, 코드를 재게시하는 경우 하우스 룰이 적용된다는 점을 기억하세요.
면책사항
해당 정보와 게시물은 금융, 투자, 트레이딩 또는 기타 유형의 조언이나 권장 사항으로 간주되지 않으며, 트레이딩뷰에서 제공하거나 보증하는 것이 아닙니다. 자세한 내용은 이용 약관을 참조하세요.
오픈 소스 스크립트
트레이딩뷰의 진정한 정신에 따라, 이 스크립트의 작성자는 이를 오픈소스로 공개하여 트레이더들이 기능을 검토하고 검증할 수 있도록 했습니다. 작성자에게 찬사를 보냅니다! 이 코드는 무료로 사용할 수 있지만, 코드를 재게시하는 경우 하우스 룰이 적용된다는 점을 기억하세요.
면책사항
해당 정보와 게시물은 금융, 투자, 트레이딩 또는 기타 유형의 조언이나 권장 사항으로 간주되지 않으며, 트레이딩뷰에서 제공하거나 보증하는 것이 아닙니다. 자세한 내용은 이용 약관을 참조하세요.