INVITE-ONLY SCRIPT
Universal RPPI Indices & Futures [SS Premium]
업데이트됨
Hello everyone,
For the much-anticipated indicator release, the universal RPPI for Futures and Indices!
If you follow me, chances are you know this indicator by now, since its the basis of all of my analyses and target prices, but if not, let me introduce you!
What is it?
The RPPI for Indices & Futures is essentially a compendium indicator. It contains hundreds of, just over 100 different math models of various futures and indices.
These models are designed to forecast the current targets on multiple timeframes including:
1. The daily
2. The weekly
3. The monthly
4. The Three Month (for SPY and QQQ ONLY)
5. The 6 Month (for DJI, SPX and USOIL/CLI1! ONLY)
6. The annual (for DJI, SPX and USOIL/CLI1! ONLY)
7. The 3 hour
So I will go over the details of the models within the indicators compendium and how they are produced. If you are not interested, just skip to the next section!
What is a model and how is it produced?
Models are math equations and frameworks that attempt to predict future behavior. They are developed in many ways and through many methods. In this particular indicator, each index and future is unique and has been created in various ways, such as using principles of data smoothing, data interpolation, data substitution and data omission.
All this means is, I have manually adjusted model parameters to correct for rare, outlier events. The outcome is having a more accurate model that is better prepared to predict what you want it to predict.
Now let's get into the indicator use.
The first thing we need to talk about is selecting a model type. Different model types are available on a handful of stocks in the indicator, such as SPY, QQQ, DJI and DIA, and so it is important to explain the difference.
Corrected vs Uncorrected Models (i.e. Low Precision vs High Precision Models)
In the settings menu, you will see the second option that reads "Precision". This is where you have the ability to select the model type.
"High Precision" is a corrected model. It is a model that I have used data manipulation for (like the examples above) to enhance its accuracy.
"Low Precision" is a UNCORRECTED model. These models have undergone no data manipulation and are just raw projections.
Which do you use?
There are only a handful of tickers that have both models, like SPY, GLD1! and DJI (among others). Some tickers perform better with low precision models, others perform better with high precision models.
To know what model works best with which stock, the indicator will tell you. At the bottom of the settings table, simply select "Show Model Data":

Selecting this, you will get a table that looks like this:

It will tell you the available model types and which one works best. For IWM, the high-precision corrected model is best. This is true for QQQ and NQ1! as well. However, for SPY and ES1!, the uncorrected model is actually better:

Sometimes, different models perform better at various levels of precision, for example, high on the monthly but low on the daily.
This is why I have omitted this option for the majority of stocks. I don't want this to be confusing to use. For 90% of the included tickers, I have selected the model of best fit. However, for a few of the very popular and volatile tickers (ES, NQ specifically), I have included the ability to use both.
Rule of Thumb:
The rule of thumb with selecting high vs low, is essentially this:
a) If the market is hugely volatility with major swings intraday that exceed its normal behaviour, switch to the low precesion model. This will not be skewed by the massive swings.
b) If the market is stable, trendy or range bound, but not trending beyond its normal, general behaviour, keep it at high precision.
With that, you will be good to go!
Using the indicator:
The indicator is intended as a standalone indicator. Of course, you can combine other indicators that you like to help you out, but there is a strategy version of this that will be released within the coming days/weeks, as this is intended to be a full strategy in and of itself.
As with the universal forecaster, you are given threshold levels that are labelled "Bullish Condition" and "Bearish Condition", a break and hold of the "Bullish Condition" and it is a long to the high targets. Inverse for the bearish condition.
In addition to these conditionals, the indicator also provides you with a high probability retracement level. These are available on the weekly, monthly and higher timeframes. A special moving retracement level is available for SPY only, however it moves based on the PA to give you a sort of POC.
Testing Model Performance:
It is possible to see model performance. At the bottom of the settings menu, select the option to "Show Demographic Data". You need to be sure you are on the chart of the selected timeframe.

This is ES1! on the daily timeframe. It shows you the demographics, i.e. the extent targets are hit, the extent that the high prob retracement targets are missed, the extent that ES closes in and out of its daily range.
This is very valuable information. This table is essentially saying there is only a 10% chance that ES will close above its range and a 9% chance ES closes below its range. This means, that the most ideal setups are a move outside of its range!!
You can view it on all timeframes. If your chart isn't aligned with the lookback, you will get a warning sign:

Misc Functions:
Show price accumulation:
There is an option to toggle on price accumulation. It will show you the amount of accumulation in each of the ranges:

This will show where the accumulation of price rests in relation to the targets.
Autoregression Assessment:
You can have the indicator plot an autoregressive trendline of the expected stock trajectory. You can select the forecast length and it will plot the direction it suspects the stock will go:

Show Standard Deviation:

In the menu, you can toggle on the show standard deviation function. This will plot the standard deviation that each price rests at. The default timeframe for standard deviation is the daily. If you are looking at the weekly, please select the weekly timeframe.
This is helpful because you can see which targets are likely based on where the standard deviation rests. In the above example, a move to the low range would be a move to -2 standard deviations and beyond. This is not something that a ticker would normally do in general circumstances.
FAQ Table:
There is also an option to display an FAQ table. This will show you model revisions and pending revision dates. This will allow you to see when each model was last updated and when new updates will be pushed:

Which models does this contain?
The indicator contains models for the following stocks:
And some more are in the works (like JETS).
NOTE: Feel free to leave a comment of future ones you would like to see!
The indicator will automatically select the model for whichever ticker you are on.
Some models are cross-compatible, such as CL1! and USOIL, but the indicator is programmed to recognize those that are cross-compatible and auto-select those models.
From there, you just need to select the timeframe you wish to view!
And that is the indicator! I know very wordy explanation but wanted to cover all basis on the indicator so you can be well prepared!
As always, leave your questions, and comments below, and safe trades!
For the much-anticipated indicator release, the universal RPPI for Futures and Indices!
If you follow me, chances are you know this indicator by now, since its the basis of all of my analyses and target prices, but if not, let me introduce you!
What is it?
The RPPI for Indices & Futures is essentially a compendium indicator. It contains hundreds of, just over 100 different math models of various futures and indices.
These models are designed to forecast the current targets on multiple timeframes including:
1. The daily
2. The weekly
3. The monthly
4. The Three Month (for SPY and QQQ ONLY)
5. The 6 Month (for DJI, SPX and USOIL/CLI1! ONLY)
6. The annual (for DJI, SPX and USOIL/CLI1! ONLY)
7. The 3 hour
So I will go over the details of the models within the indicators compendium and how they are produced. If you are not interested, just skip to the next section!
What is a model and how is it produced?
Models are math equations and frameworks that attempt to predict future behavior. They are developed in many ways and through many methods. In this particular indicator, each index and future is unique and has been created in various ways, such as using principles of data smoothing, data interpolation, data substitution and data omission.
All this means is, I have manually adjusted model parameters to correct for rare, outlier events. The outcome is having a more accurate model that is better prepared to predict what you want it to predict.
Now let's get into the indicator use.
The first thing we need to talk about is selecting a model type. Different model types are available on a handful of stocks in the indicator, such as SPY, QQQ, DJI and DIA, and so it is important to explain the difference.
Corrected vs Uncorrected Models (i.e. Low Precision vs High Precision Models)
In the settings menu, you will see the second option that reads "Precision". This is where you have the ability to select the model type.
"High Precision" is a corrected model. It is a model that I have used data manipulation for (like the examples above) to enhance its accuracy.
"Low Precision" is a UNCORRECTED model. These models have undergone no data manipulation and are just raw projections.
Which do you use?
There are only a handful of tickers that have both models, like SPY, GLD1! and DJI (among others). Some tickers perform better with low precision models, others perform better with high precision models.
To know what model works best with which stock, the indicator will tell you. At the bottom of the settings table, simply select "Show Model Data":
Selecting this, you will get a table that looks like this:
It will tell you the available model types and which one works best. For IWM, the high-precision corrected model is best. This is true for QQQ and NQ1! as well. However, for SPY and ES1!, the uncorrected model is actually better:
Sometimes, different models perform better at various levels of precision, for example, high on the monthly but low on the daily.
This is why I have omitted this option for the majority of stocks. I don't want this to be confusing to use. For 90% of the included tickers, I have selected the model of best fit. However, for a few of the very popular and volatile tickers (ES, NQ specifically), I have included the ability to use both.
Rule of Thumb:
The rule of thumb with selecting high vs low, is essentially this:
a) If the market is hugely volatility with major swings intraday that exceed its normal behaviour, switch to the low precesion model. This will not be skewed by the massive swings.
b) If the market is stable, trendy or range bound, but not trending beyond its normal, general behaviour, keep it at high precision.
With that, you will be good to go!
Using the indicator:
The indicator is intended as a standalone indicator. Of course, you can combine other indicators that you like to help you out, but there is a strategy version of this that will be released within the coming days/weeks, as this is intended to be a full strategy in and of itself.
As with the universal forecaster, you are given threshold levels that are labelled "Bullish Condition" and "Bearish Condition", a break and hold of the "Bullish Condition" and it is a long to the high targets. Inverse for the bearish condition.
In addition to these conditionals, the indicator also provides you with a high probability retracement level. These are available on the weekly, monthly and higher timeframes. A special moving retracement level is available for SPY only, however it moves based on the PA to give you a sort of POC.
Testing Model Performance:
It is possible to see model performance. At the bottom of the settings menu, select the option to "Show Demographic Data". You need to be sure you are on the chart of the selected timeframe.
This is ES1! on the daily timeframe. It shows you the demographics, i.e. the extent targets are hit, the extent that the high prob retracement targets are missed, the extent that ES closes in and out of its daily range.
This is very valuable information. This table is essentially saying there is only a 10% chance that ES will close above its range and a 9% chance ES closes below its range. This means, that the most ideal setups are a move outside of its range!!
You can view it on all timeframes. If your chart isn't aligned with the lookback, you will get a warning sign:
Misc Functions:
Show price accumulation:
There is an option to toggle on price accumulation. It will show you the amount of accumulation in each of the ranges:
This will show where the accumulation of price rests in relation to the targets.
Autoregression Assessment:
You can have the indicator plot an autoregressive trendline of the expected stock trajectory. You can select the forecast length and it will plot the direction it suspects the stock will go:
Show Standard Deviation:
In the menu, you can toggle on the show standard deviation function. This will plot the standard deviation that each price rests at. The default timeframe for standard deviation is the daily. If you are looking at the weekly, please select the weekly timeframe.
This is helpful because you can see which targets are likely based on where the standard deviation rests. In the above example, a move to the low range would be a move to -2 standard deviations and beyond. This is not something that a ticker would normally do in general circumstances.
FAQ Table:
There is also an option to display an FAQ table. This will show you model revisions and pending revision dates. This will allow you to see when each model was last updated and when new updates will be pushed:
Which models does this contain?
The indicator contains models for the following stocks:
- SPY
- QQQ
- DIA
- DJI
- ES1!
- SPX
- NQ1!
- NDX
- SOXX
- IWM
- RTY
- GCL1! (Gold)
- CL1! / USOIL (Oil)
- XLE
- XLF
- YM1!
And some more are in the works (like JETS).
NOTE: Feel free to leave a comment of future ones you would like to see!
The indicator will automatically select the model for whichever ticker you are on.
Some models are cross-compatible, such as CL1! and USOIL, but the indicator is programmed to recognize those that are cross-compatible and auto-select those models.
From there, you just need to select the timeframe you wish to view!
And that is the indicator! I know very wordy explanation but wanted to cover all basis on the indicator so you can be well prepared!
As always, leave your questions, and comments below, and safe trades!
릴리즈 노트
Added SPY Annual levels.릴리즈 노트
Wheat futures added based on community request. 릴리즈 노트
COCOA futures added per community request.As well, the ability to extend ranges when a range has been exceeded has now been added:
This function is automatic and doesn't require any setting adjustments.
릴리즈 노트
Per popular demand.... BTC1! Futures have been added!!!릴리즈 노트
Major additions added based on popular request, some errors fixed (lack of BTC toggle button) and some other minor bug fixes. Recent Additions:
Commodities: SB1!, ZW1!, CC1!, ZL1!, CT1!
BTC Futures: BTC1!
Indicies: JETS, KRE, XLRE, and ITA
릴리즈 노트
Added following tickers:-Crypto-
BTCUSD
ETHUSD
- Foreign Indicies -
INVE_B
릴리즈 노트
Routine update.릴리즈 노트
Update fix, sorry about that, I accidently made it so the indicator disappeared! 릴리즈 노트
Revised one final time,In addition to routine updates, a high prob target on the weekly was added for BTCUSD.
릴리즈 노트
Fixed one final thing.Next update will be in 3 months.
Safe trades!
릴리즈 노트
Forgot to do the following updates:- QQQ Daily
- SPY Daily
These have been amended.
Please be sure to pay attention to the model data portion of the indicator!
Thanks!
릴리즈 노트
Per everyone's request, the trailing low and trailing high GT has been added for SPY and QQQ. This gives the ability for the user to see when the low of day has been put in and when the high of day has likely been put in. The trailing low GT will start low and the trailing high GT will start high.
When the ticker moves, it, theoretically, needs to hit both targets, both targets need to be in contact with the PA during the day. Both move. So if we see that we hit the high but not the low and the low is not moving up, you know that low of day is not in and we will sell, if the low gt gets pulled up with the PA and makes contact with the PA, you know that its more than likely the low of day is in, and its up.
Enjoy! And as always let me know your questions!
릴리즈 노트
NIFTY added based on popular request. 릴리즈 노트
Hey everyone,So with the RPPI approaching its 1 year anniversary and with the evolution of the Steversteves trading group, I thought it was time to bring the RPPI up to where we are now.
This update completely overhauls the RPPI. While the base functionality remains the same, here are the following amendments and changes:
- 3 Hour levels replaced with 1 hour levels.
- The ability of the RPPI to auto generate its own models on the Daily, Weekly and Monthly.
- Replaced the probability functions with more real time probability functions, such as tracking EMA probabilities.
- Incorporation on ANOVA.
- Incorporation of Machine Learning Supply and Demand identification.
- The ability to use a forecast based SMA of either a linear, quadratic, quartic or cubic model.
- The ability to use multimodal forecasting and draw time series forecasting using quadratic, linear, quartic or cubic models.
- The models have been revised and updated.
- Opening up the RPPI’s ability to integrate with R Language and have models exported into the RPPI itself.
- The ability for the RPPI to advise you on threshold breaks and the likelihood of success.
I know it sounds like a lot, but the RPPI fundamentally remains the same and you will not notice much of a change from the base line functionality. However, the options have expanded now within the settings menu.
Here some quick tips and tricks:
Having the RPPI Autogenerate a model:
Go to the settings, and in the “Ticker Select” menu, select “RPPI Auto-Generate”. Select your timeframe, either daily, weekly or monthly and the RPPI will auto generate the model for you.
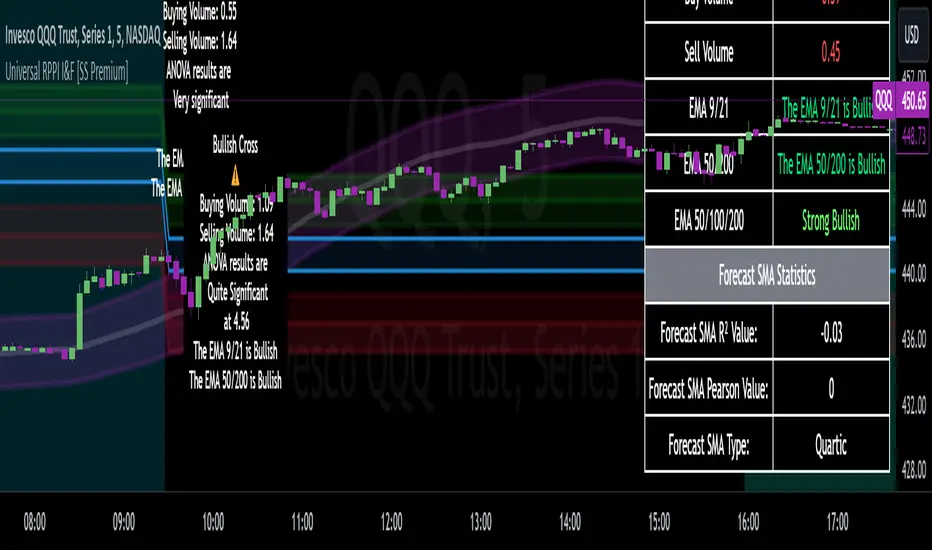
Displaying trend statistics:
Scroll down to the “Trend Information” menu and select “Plot real time stats”
Display Supply and Demand Alerts:
Scroll down to the “Volumetrica” menu and select “Plot Supply and Demand”.
Accessing the Forecast SMA:
Scroll down to the “Forecast Based SMA” settings menu and select the model you want. The options are Linear, Quadratic, Cubic and Quartic. The default lookback is at 75 and I suggest either keeping it here or expanding it out.
If you have the Stats table open, it will display for you the results of the forecast SMA including the Pearson Correlation and the R Squared value.
And those are the updates! In addition, the following models were added:
XBI
Safe trades everyone!
릴리즈 노트
Some fixes since last update, no changes to the overall functions or app, just some errors that had to be fixed!릴리즈 노트
Omitted a critical fix in the previous update push regarding the threshold crosses. All is fixed now and operational.
릴리즈 노트
ANOVA significance and value pushed to stats table: 릴리즈 노트
Some minor updates, as well, very excited to announce: GLD has been added since it's the hot item right now!
Safe trades everyone!
초대 전용 스크립트
이 스크립트에 대한 접근은 작성자가 승인한 사용자로 제한되며, 일반적으로 지불이 필요합니다. 즐겨찾기에 추가할 수 있지만 권한을 요청하고 작성자에게 권한을 받은 후에만 사용할 수 있습니다. 자세한 내용은 Steversteves에게 문의하거나 아래의 작성자의 지시사항을 따르십시오.
트레이딩뷰는 스크립트 작성자를 100% 신뢰하고 스크립트 작동 원리를 이해하지 않는 한 스크립트 비용을 지불하고 사용하는 것을 권장하지 않습니다. 대부분의 경우 커뮤니티 스크립트에서 무료로 좋은 오픈소스 대안을 찾을 수 있습니다.
작성자 지시 사항
″To access the indicator, please contact me on Tradingview or visit: https://www.patreon.com/steversteves
차트에 이 스크립트를 사용하시겠습니까?
경고: 액세스를 요청하기 전에 읽어 보시기 바랍니다.
For real-time updates and premium indicators, consider joining my group at: patreon.com/steversteves
면책사항
이 정보와 게시물은 TradingView에서 제공하거나 보증하는 금융, 투자, 거래 또는 기타 유형의 조언이나 권고 사항을 의미하거나 구성하지 않습니다. 자세한 내용은 이용 약관을 참고하세요.