Transient Zones
Updated version 1.1:

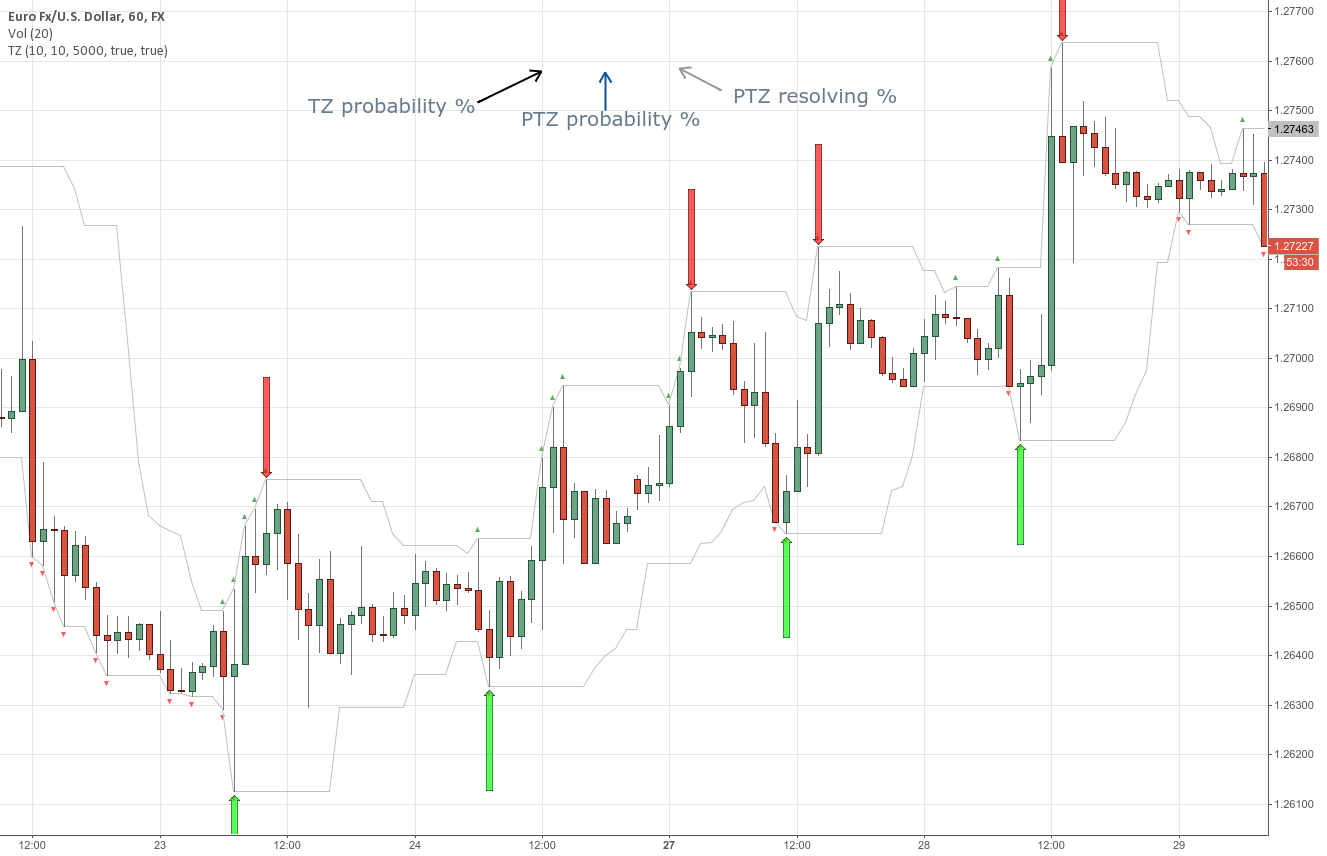
Simple indicator to visualize Transient Zones (TZ) and Potential Transient Zones (PTZ).
Original ForexFactory thread by EURUSDD www.forexfactor.../showthread.php?t=434603&a...
Todo:
- Mid bar transient zones detection
- Draw rectangles for zones (once rectangle drawing gets implemented in pine script)
- Mark forming PTZs more clearly
study("Transient Zones", "TZ", overlay=true)
h_left = input(title="h left", type=integer, defval=10)
h_right = input(title="h right", type=integer, defval=10)
show_ptz = input(title="Show PTZ", type=bool, defval=true)
show_channel = input(title="Show channel", type=bool, defval=true)
//barCount = nz(barCount[1]) + 1
//check history and realtime PTZ
h_left_low = lowest(h_left)
h_left_high = highest(h_left)
newlow = low <= h_left_low
newhigh = high >= h_left_high
plotshape(newlow and show_ptz, style=shape.triangledown, location=location.belowbar, color=red)
plotshape(newhigh and show_ptz, style=shape.triangleup, location=location.abovebar, color=green)
channel_high = plot(show_channel ? h_left_low : 0, color=silver)
channel_low = plot (show_channel ? h_left_high : 0, color=silver)
//check true TZ back in history
central_bar_low = low[h_right + 1]
central_bar_high = high[h_right + 1]
full_zone_low = lowest(h_left + h_right + 1)
full_zone_high = highest(h_left + h_right + 1)
central_bar_is_highest = central_bar_high >= full_zone_high
central_bar_is_lowest = central_bar_low <= full_zone_low
plotarrow(central_bar_is_highest ? -1 : 0, offset=-h_right-1)
plotarrow(central_bar_is_lowest ? 1 : 0, offset=-h_right-1)