OPEN-SOURCE SCRIPT
VWAP Trend
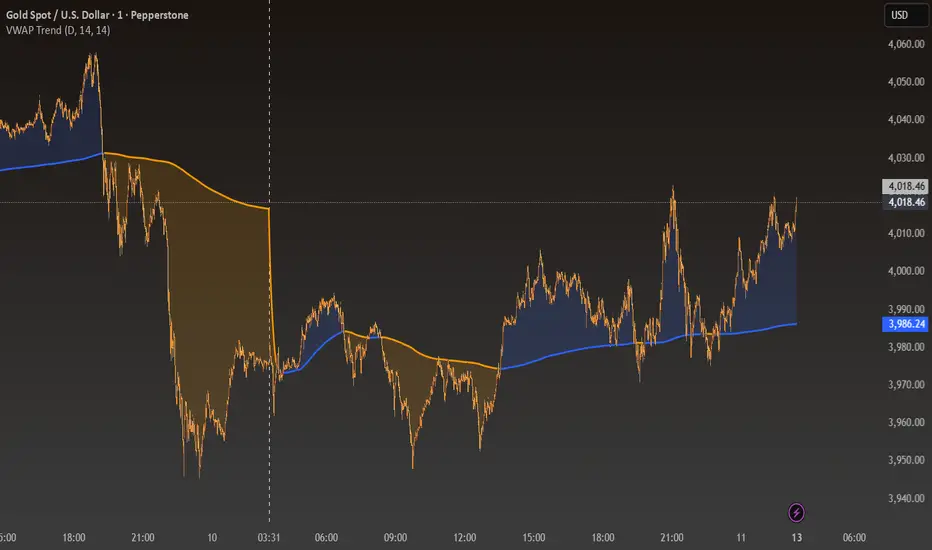
The VWAP Trend indicator is a powerful visualization tool that blends a smoothed Volume-Weighted Average Price (VWAP) with a trend-following EMA to reveal the underlying market bias in a clear, color-coded format.
Unlike a standard VWAP that only resets intraday, VWAP Trend allows traders to anchor VWAP calculations to Daily, Weekly, or Monthly sessions. This flexibility makes it suitable for all trading styles — from intraday scalping to long-term swing analysis.
The smoothed VWAP provides a stable representation of the true average price weighted by volume, while the EMA reflects the prevailing market trend. When the EMA remains above the VWAP, the indicator highlights bullish conditions with blue tones. When it moves below, bearish momentum is displayed with orange tones.
Features
Adjustable VWAP anchor timeframe (Daily, Weekly, or Monthly)
Smoothed VWAP for reduced noise and improved accuracy
Dynamic EMA overlay for real-time trend detection
Color-coded shading between price and VWAP
Minimalist design ideal for clean chart analysis
How to Use
Select your preferred VWAP anchor timeframe.
Observe how the shading color shifts between blue (bullish) and orange (bearish).
Use these transitions to gauge market bias, confirm trade setups, or identify potential mean reversion zones.
오픈 소스 스크립트
진정한 트레이딩뷰 정신에 따라 이 스크립트 작성자는 트레이더가 기능을 검토하고 검증할 수 있도록 오픈소스로 공개했습니다. 작성자에게 찬사를 보냅니다! 무료로 사용할 수 있지만 코드를 다시 게시할 경우 하우스 룰이 적용된다는 점을 기억하세요.
면책사항
이 정보와 게시물은 TradingView에서 제공하거나 보증하는 금융, 투자, 거래 또는 기타 유형의 조언이나 권고 사항을 의미하거나 구성하지 않습니다. 자세한 내용은 이용 약관을 참고하세요.
오픈 소스 스크립트
진정한 트레이딩뷰 정신에 따라 이 스크립트 작성자는 트레이더가 기능을 검토하고 검증할 수 있도록 오픈소스로 공개했습니다. 작성자에게 찬사를 보냅니다! 무료로 사용할 수 있지만 코드를 다시 게시할 경우 하우스 룰이 적용된다는 점을 기억하세요.
면책사항
이 정보와 게시물은 TradingView에서 제공하거나 보증하는 금융, 투자, 거래 또는 기타 유형의 조언이나 권고 사항을 의미하거나 구성하지 않습니다. 자세한 내용은 이용 약관을 참고하세요.