OPEN-SOURCE SCRIPT
업데이트됨 EMA(20,50,200)

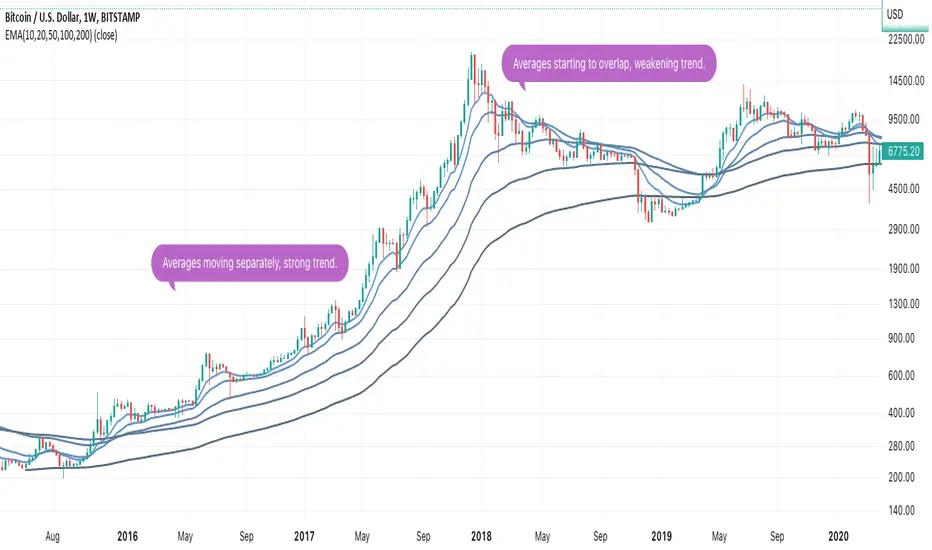
Exponential Moving Average on last 20, 50 and 200 close prices.
릴리즈 노트
Exponential Moving Average IndicatorDraws exponential moving average prices as a line chart for three different time frames.
1) The last 21 bars (close price)
2) The last 50 bars (close price)
3) The last 200 bars (close price)
In contrast to the SMA (Simple Moving Average), this moving average "stays closer to the current price", that is, reacting stronger to price changes.
릴리즈 노트
Add another EMA(100) to the script. Reduce default transparency to 50%. Can be overridden in the settings.릴리즈 노트
* - Updated to PineScript v.5
- Updated colors
- Minor bug fixes
오픈 소스 스크립트
트레이딩뷰의 진정한 정신에 따라, 이 스크립트의 작성자는 이를 오픈소스로 공개하여 트레이더들이 기능을 검토하고 검증할 수 있도록 했습니다. 작성자에게 찬사를 보냅니다! 이 코드는 무료로 사용할 수 있지만, 코드를 재게시하는 경우 하우스 룰이 적용된다는 점을 기억하세요.
면책사항
해당 정보와 게시물은 금융, 투자, 트레이딩 또는 기타 유형의 조언이나 권장 사항으로 간주되지 않으며, 트레이딩뷰에서 제공하거나 보증하는 것이 아닙니다. 자세한 내용은 이용 약관을 참조하세요.
오픈 소스 스크립트
트레이딩뷰의 진정한 정신에 따라, 이 스크립트의 작성자는 이를 오픈소스로 공개하여 트레이더들이 기능을 검토하고 검증할 수 있도록 했습니다. 작성자에게 찬사를 보냅니다! 이 코드는 무료로 사용할 수 있지만, 코드를 재게시하는 경우 하우스 룰이 적용된다는 점을 기억하세요.
면책사항
해당 정보와 게시물은 금융, 투자, 트레이딩 또는 기타 유형의 조언이나 권장 사항으로 간주되지 않으며, 트레이딩뷰에서 제공하거나 보증하는 것이 아닙니다. 자세한 내용은 이용 약관을 참조하세요.