PROTECTED SOURCE SCRIPT
Strategy Based on Percent of Stocks Above/Below Key Moving
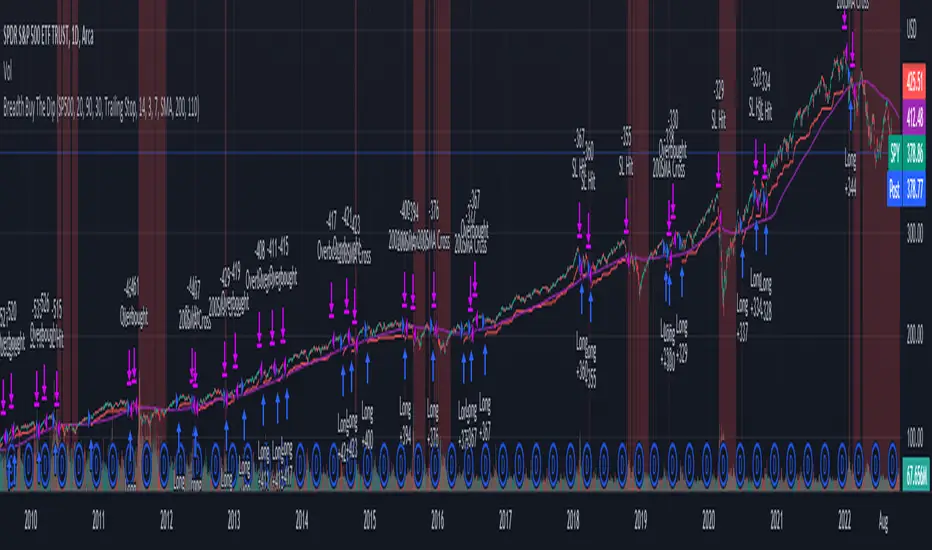
This Strategy looks to buy the market after the percentage of stocks below the 20 SMA moving average drops below 30% and crosses back above it. The strategy outperforms buy and hold on the S&P and more importantly only has a max draw down of 11% which gives it a much better risk adjusted performance then buy and hold alone.
It has three sell rules, 1. When the same indicator crosses into overbought territory. 2. Index Closes below the 200 SMA. 3. Stop Loss is triggered (default is Trailing stop loss).
The indicator used can be found here :

The Strategy has been coded so that all the variables can be adjusted so you can tweak it to get the best performance to whatever market you like. I have hard coded the best variables I could find to trade the SPY.
SPY.
You can track market breadth on the following markets:
Market Tickers Available = SP500 , DJI, NQ, NQ100, R2000, R3000, SP500 Financials, SP500 Materials, SP500 Energy, SP500 Staples, SP500 Discretionary, SP500 Industrials , SP500 Real Estates, Overall Market
The strategy can be used on any of these moving averages : 20, 50, 100, 150, 200
You can adjust the greed and fear levels to change when the strategy takes trades at Overbought and Oversold Levels
Stop Loss
Two Stop losses are available a fixed stop loss based on an ATR value or a trailing % Stop Loss
Regime Filters
Two Regime filters are available:
1. a simple moving average (Strategy wont take trades under the 200 SMA)
2. Advance/Decline Filter Details can be found here:![[KY]Cumulative Advance Decline Line](https://s3.tradingview.com/s/S1GcKule_mid.png)
Date Filter
It has three sell rules, 1. When the same indicator crosses into overbought territory. 2. Index Closes below the 200 SMA. 3. Stop Loss is triggered (default is Trailing stop loss).
The indicator used can be found here :
The Strategy has been coded so that all the variables can be adjusted so you can tweak it to get the best performance to whatever market you like. I have hard coded the best variables I could find to trade the
You can track market breadth on the following markets:
Market Tickers Available = SP500 , DJI, NQ, NQ100, R2000, R3000, SP500 Financials, SP500 Materials, SP500 Energy, SP500 Staples, SP500 Discretionary, SP500 Industrials , SP500 Real Estates, Overall Market
The strategy can be used on any of these moving averages : 20, 50, 100, 150, 200
You can adjust the greed and fear levels to change when the strategy takes trades at Overbought and Oversold Levels
Stop Loss
Two Stop losses are available a fixed stop loss based on an ATR value or a trailing % Stop Loss
Regime Filters
Two Regime filters are available:
1. a simple moving average (Strategy wont take trades under the 200 SMA)
2. Advance/Decline Filter Details can be found here:
Date Filter
보호된 스크립트입니다
이 스크립트는 비공개 소스로 게시됩니다. 하지만 이를 자유롭게 제한 없이 사용할 수 있습니다 – 자세한 내용은 여기에서 확인하세요.
면책사항
해당 정보와 게시물은 금융, 투자, 트레이딩 또는 기타 유형의 조언이나 권장 사항으로 간주되지 않으며, 트레이딩뷰에서 제공하거나 보증하는 것이 아닙니다. 자세한 내용은 이용 약관을 참조하세요.
면책사항
해당 정보와 게시물은 금융, 투자, 트레이딩 또는 기타 유형의 조언이나 권장 사항으로 간주되지 않으며, 트레이딩뷰에서 제공하거나 보증하는 것이 아닙니다. 자세한 내용은 이용 약관을 참조하세요.