PROTECTED SOURCE SCRIPT
업데이트됨 B4100 - NW Trend
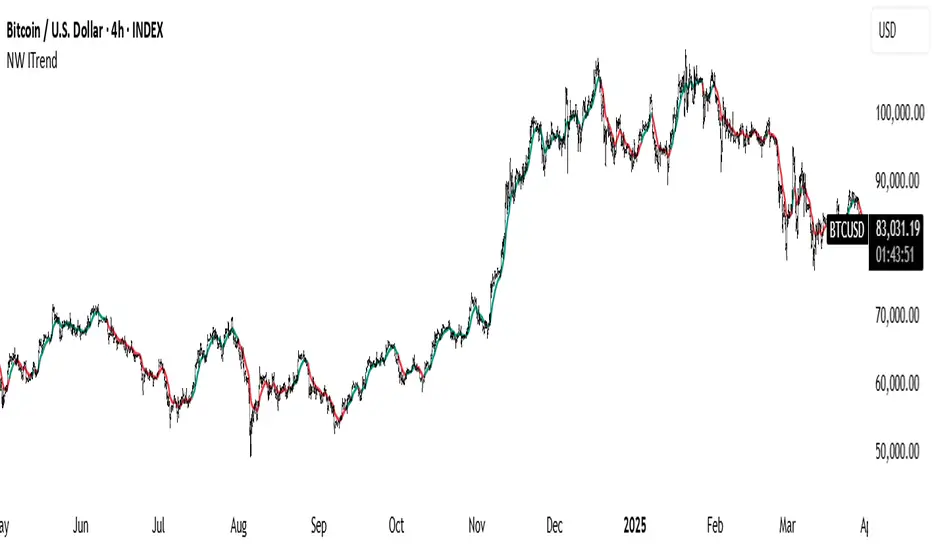
This is a trend-following tool based on the Nadaraya-Watson (NW) kernel regression estimator.
Nadaraya-Watson Estimator:
This indicator employs a weighted average of historical prices where the weights are determined by a kernel function. This kernel function gives more weight to recent prices and less weight to older ones. The kernel function's shape (Gaussian, Epanechnikov, or a combination) can be chosen by the user, and its bandwidth controls the sensitivity of the estimator. A smaller value means more sensitivity to short-term changes; a larger value means smoother curves and less sensitivity.
Trend Confirmation:
The indicator also uses a confirmation period (confirm_period) to minimize whipsaws. The trend only changes once the estimator has moved in a particular direction for a configurable number of consecutive bars.
Bandwidth (h):
This is the key parameter controlling the estimator's sensitivity to price changes.
Smaller values (e.g., 10-40) result in a more reactive and wiggly line. This will be more sensitive to short-term price changes.
Larger values (e.g., 100-200) result in a smoother line, focusing on longer-term trends.
Source:
The price data used in the calculations. The default is close but can be changed to other price values such as high, low, or a mathematical combination.
Kernel Type:
Select the type of kernel function to use.
Confirmation Period:
Adjust this setting to specify how many consecutive bars the estimator must be moving in the same direction before the trend is confirmed.
Lower values result in more trend changes.
Higher values result in fewer trend changes and can filter out some noise.
Enjoy, and good luck.
릴리즈 노트
Add Ehlers ITrend보호된 스크립트입니다
이 스크립트는 비공개 소스로 게시됩니다. 하지만 이를 자유롭게 제한 없이 사용할 수 있습니다 – 자세한 내용은 여기에서 확인하세요.
면책사항
해당 정보와 게시물은 금융, 투자, 트레이딩 또는 기타 유형의 조언이나 권장 사항으로 간주되지 않으며, 트레이딩뷰에서 제공하거나 보증하는 것이 아닙니다. 자세한 내용은 이용 약관을 참조하세요.
면책사항
해당 정보와 게시물은 금융, 투자, 트레이딩 또는 기타 유형의 조언이나 권장 사항으로 간주되지 않으며, 트레이딩뷰에서 제공하거나 보증하는 것이 아닙니다. 자세한 내용은 이용 약관을 참조하세요.