PROTECTED SOURCE SCRIPT
업데이트됨 Pristine Volume Analysis
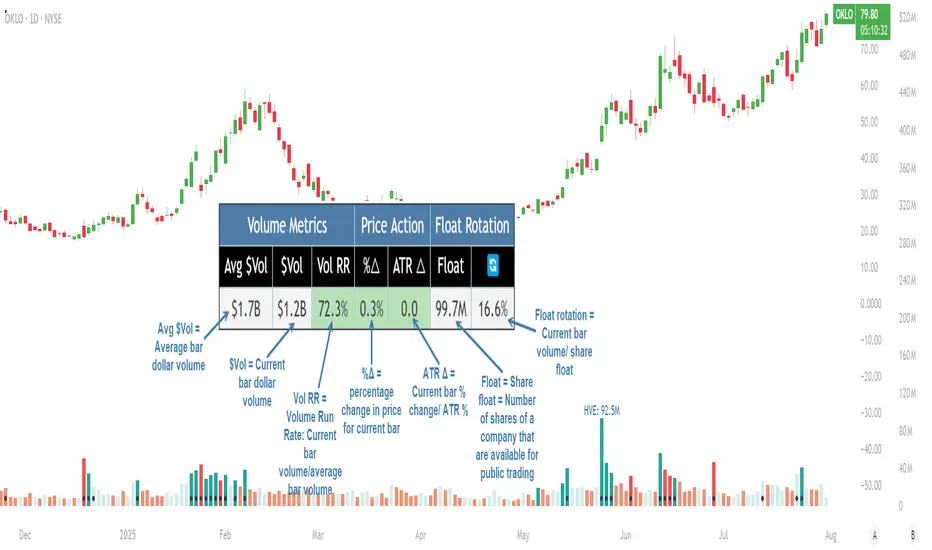
The Pristine Volume Analysis indicator organizes volume, liquidity, and share structure data, allowing users to quickly gauge the relative volume a security is trading on, and whether it is liquid enough to trade🏆
Volume is an important metric to track when trading, because abnormally high volume tends to occur when a new trend is kicking off, or when an established trend is hitting a climax.
Track only the most important metrics, reducing mental clutter and noise:
▪ Volume run rate - Candle volume/ Avg candle volume
▪ Security liquidity - Average volume and average dollar volume
▪ Float rotation - Candle volume/ Float
This script automatically detects and flags the following conditions on volume bars:
▪ High volume run rate buying/selling based on user-defined thresholds
▪ HVE (highest volume ever) & HVY (highest volume in a year)
▪ High float rotation based on user-defined thresholds

Settings and Preferences
Customize this script based by setting preferred colors and thresholds:

Custom Alerts on HVE and HVY
Set custom alerts on a single equity or an entire watchlist to receive notifications when volume hits HVE or HVY.

Screen for HVE or HVY
Using the Pine Screener, scan watchlists for equities that have reached HVE or HVY.

Note: The Pine Screener is limited to calculations on the last 500 bars. If a symbol has less than 500 bars and has reached HVE, it will be included in the screener results. All symbols with more than 500 historical bars will not be included in the scan.
Volume Analysis Use Case : Confirming a breakout (1/3)
A high volume run rate as a stock breaks out to new highs can confirm a change of character and increase the odds of success on long setups. SMCI put in an HVE candle in January '24, sparking a super-performance run.

1-Month follow-through +137%
SMCI had plenty of gas left in the tank after putting in it's first HVE candle. The rest is history!

Volume Analysis Use Case : Gauging sentiment (2/3)
When a stock advances on repeated high run rate volume and an increasing angle of ascent (parabolic), it can be a good indication that sentiment is overheated and it is time to reduce exposure to the stock.
Note:25% is the default float rotation threshold. This value can be customized based on your own trading style and preferences.

Following the parabolic ascent on high volume run rate and float rotation, HIMS topped, falling ~67% over the next two months!

Volume Analysis Use Case : Passing on a meme stock (3/3)
High float rotation often goes hand-in-hand with high stock volatility. One might opt out of trading a stock if it is outside their risk tolerance.

Volume is an important metric to track when trading, because abnormally high volume tends to occur when a new trend is kicking off, or when an established trend is hitting a climax.
Track only the most important metrics, reducing mental clutter and noise:
▪ Volume run rate - Candle volume/ Avg candle volume
▪ Security liquidity - Average volume and average dollar volume
▪ Float rotation - Candle volume/ Float
This script automatically detects and flags the following conditions on volume bars:
▪ High volume run rate buying/selling based on user-defined thresholds
▪ HVE (highest volume ever) & HVY (highest volume in a year)
▪ High float rotation based on user-defined thresholds
Settings and Preferences
Customize this script based by setting preferred colors and thresholds:
Custom Alerts on HVE and HVY
Set custom alerts on a single equity or an entire watchlist to receive notifications when volume hits HVE or HVY.
Screen for HVE or HVY
Using the Pine Screener, scan watchlists for equities that have reached HVE or HVY.
Note: The Pine Screener is limited to calculations on the last 500 bars. If a symbol has less than 500 bars and has reached HVE, it will be included in the screener results. All symbols with more than 500 historical bars will not be included in the scan.
Volume Analysis Use Case : Confirming a breakout (1/3)
A high volume run rate as a stock breaks out to new highs can confirm a change of character and increase the odds of success on long setups. SMCI put in an HVE candle in January '24, sparking a super-performance run.
1-Month follow-through +137%
SMCI had plenty of gas left in the tank after putting in it's first HVE candle. The rest is history!
Volume Analysis Use Case : Gauging sentiment (2/3)
When a stock advances on repeated high run rate volume and an increasing angle of ascent (parabolic), it can be a good indication that sentiment is overheated and it is time to reduce exposure to the stock.
Note:25% is the default float rotation threshold. This value can be customized based on your own trading style and preferences.
Following the parabolic ascent on high volume run rate and float rotation, HIMS topped, falling ~67% over the next two months!
Volume Analysis Use Case : Passing on a meme stock (3/3)
High float rotation often goes hand-in-hand with high stock volatility. One might opt out of trading a stock if it is outside their risk tolerance.
릴리즈 노트
Version 1.1▪ Added an option to remove the header row of the table
보호된 스크립트입니다
이 스크립트는 비공개 소스로 게시됩니다. 하지만 이를 자유롭게 제한 없이 사용할 수 있습니다 – 자세한 내용은 여기에서 확인하세요.
Access our tools here: tools.pristinecapital.net
면책사항
해당 정보와 게시물은 금융, 투자, 트레이딩 또는 기타 유형의 조언이나 권장 사항으로 간주되지 않으며, 트레이딩뷰에서 제공하거나 보증하는 것이 아닙니다. 자세한 내용은 이용 약관을 참조하세요.
보호된 스크립트입니다
이 스크립트는 비공개 소스로 게시됩니다. 하지만 이를 자유롭게 제한 없이 사용할 수 있습니다 – 자세한 내용은 여기에서 확인하세요.
Access our tools here: tools.pristinecapital.net
면책사항
해당 정보와 게시물은 금융, 투자, 트레이딩 또는 기타 유형의 조언이나 권장 사항으로 간주되지 않으며, 트레이딩뷰에서 제공하거나 보증하는 것이 아닙니다. 자세한 내용은 이용 약관을 참조하세요.