OPEN-SOURCE SCRIPT
LSMA Crossover
This is a simple script designed to help filter out bad trades. LSMA is a trend king and by using the 21,200 and 1000 length lines traders can get a clear view of where price action is travelling. This indicator is the perfect companion to the LSMA Wave Rider indicator. Once a pullback is discovered (price action crosses under blue or white line) Traders can use LSMA Wave Rider to locate perfect entry point.
Least Squares Moving Average follows these rules:
When price crosses over it signals a bull trend.
When price crosses under it signals bear trend.
When price stays close or on the line sideways action is to be expected.
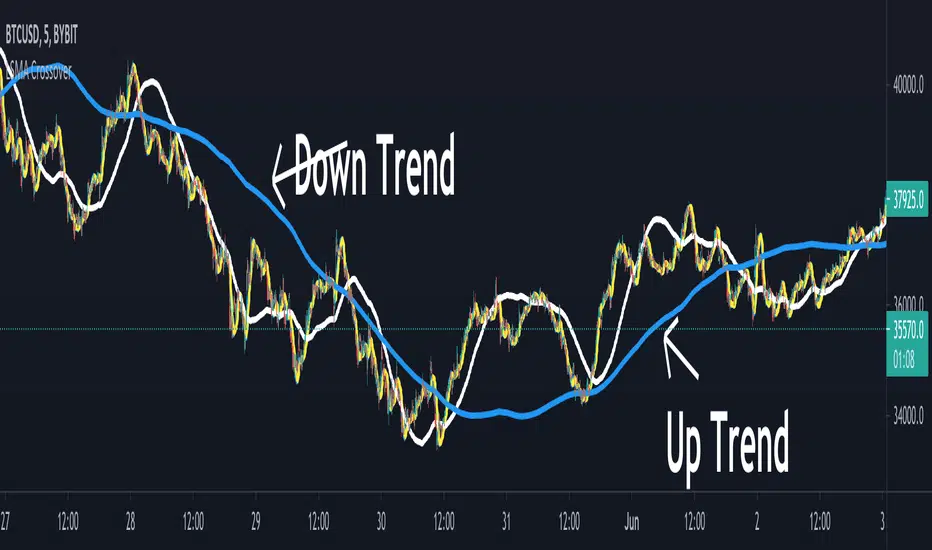
The direction of the line shows the direction of the trend.

Here is an example of finding good trades. Price action pulls below white or blue line.

Another example of what a pullback looks like.

This example shows how to find trend using crossovers.

Another example how trend can be found but by using line direction.
LSMA Wave Rider can be found here:

Least Squares Moving Average follows these rules:
When price crosses over it signals a bull trend.
When price crosses under it signals bear trend.
When price stays close or on the line sideways action is to be expected.
The direction of the line shows the direction of the trend.
Here is an example of finding good trades. Price action pulls below white or blue line.
Another example of what a pullback looks like.
This example shows how to find trend using crossovers.
Another example how trend can be found but by using line direction.
LSMA Wave Rider can be found here:
오픈 소스 스크립트
트레이딩뷰의 진정한 정신에 따라, 이 스크립트의 작성자는 이를 오픈소스로 공개하여 트레이더들이 기능을 검토하고 검증할 수 있도록 했습니다. 작성자에게 찬사를 보냅니다! 이 코드는 무료로 사용할 수 있지만, 코드를 재게시하는 경우 하우스 룰이 적용된다는 점을 기억하세요.
면책사항
해당 정보와 게시물은 금융, 투자, 트레이딩 또는 기타 유형의 조언이나 권장 사항으로 간주되지 않으며, 트레이딩뷰에서 제공하거나 보증하는 것이 아닙니다. 자세한 내용은 이용 약관을 참조하세요.
오픈 소스 스크립트
트레이딩뷰의 진정한 정신에 따라, 이 스크립트의 작성자는 이를 오픈소스로 공개하여 트레이더들이 기능을 검토하고 검증할 수 있도록 했습니다. 작성자에게 찬사를 보냅니다! 이 코드는 무료로 사용할 수 있지만, 코드를 재게시하는 경우 하우스 룰이 적용된다는 점을 기억하세요.
면책사항
해당 정보와 게시물은 금융, 투자, 트레이딩 또는 기타 유형의 조언이나 권장 사항으로 간주되지 않으며, 트레이딩뷰에서 제공하거나 보증하는 것이 아닙니다. 자세한 내용은 이용 약관을 참조하세요.