PROTECTED SOURCE SCRIPT
Hammer Candle Finder [MQSXN]
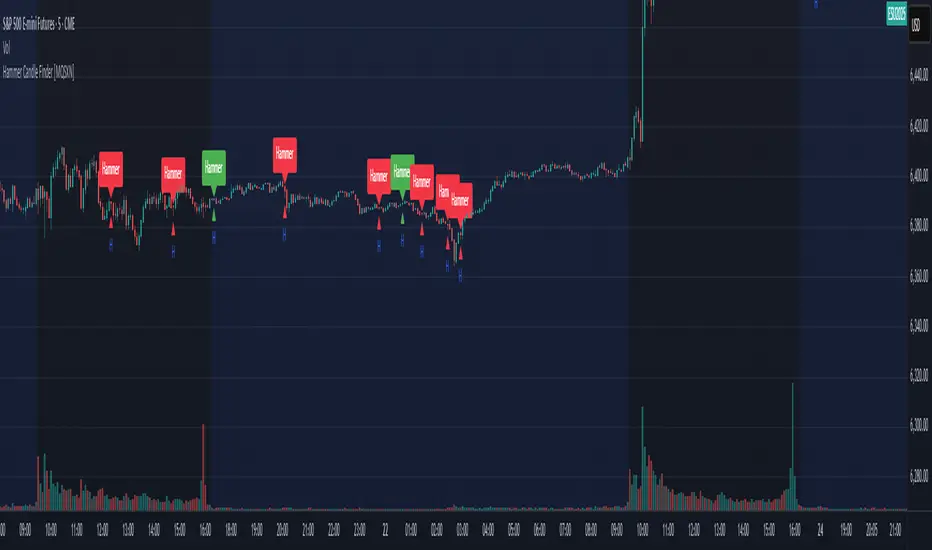
This script automatically scans your chart for hammer candlestick patterns and highlights them with fully customizable labels and markers. Hammers are classic price action signals that can suggest potential reversals or exhaustion in the current trend.
How it works:
- Detects candles with a small body near the top of the range, a long lower wick, and minimal upper wick.
- Separates bullish hammers (green close above open) from bearish hammers (red close below open).
- You can choose to display either type—or both—depending on your trading style.
Customizable options:
- Adjustable detection sensitivity (body % of range, wick-to-body ratio, top wick allowance).
- Toggle to show/hide bullish or bearish signals.
- Custom text, colors, label style, and positioning for the markers.
- Option to anchor labels above bars automatically or offset them by a set number of ticks.
Usage:
This tool is designed for traders who want a clear, visual way to spot hammer candles in real time or during historical chart analysis. Combine it with your own support/resistance zones, volume analysis, or confirmation indicators to build complete strategies.
Note:
This indicator does not provide buy/sell signals on its own—it’s meant to assist with candlestick recognition. Always confirm with your broader trading plan and risk management rules.
보호된 스크립트입니다
이 스크립트는 비공개 소스로 게시됩니다. 하지만 이를 자유롭게 제한 없이 사용할 수 있습니다 – 자세한 내용은 여기에서 확인하세요.
면책사항
해당 정보와 게시물은 금융, 투자, 트레이딩 또는 기타 유형의 조언이나 권장 사항으로 간주되지 않으며, 트레이딩뷰에서 제공하거나 보증하는 것이 아닙니다. 자세한 내용은 이용 약관을 참조하세요.
면책사항
해당 정보와 게시물은 금융, 투자, 트레이딩 또는 기타 유형의 조언이나 권장 사항으로 간주되지 않으며, 트레이딩뷰에서 제공하거나 보증하는 것이 아닙니다. 자세한 내용은 이용 약관을 참조하세요.