OPEN-SOURCE SCRIPT
HODL LINE [AstrideUnicorn]
This indicator determines periods of bull market when a buy-and-hold investor can hold the asset, and bear market periods when they should avoid holding it. Though it was designed primarily with cryptocurrencies in mind, it can be successfully used for any market.
Technically, the indicator is an asymmetric trend filter aimed to account for the fact that market sell-offs tend to be sharper than up-trends. The algorithm has two regimes – with and without price smoothing.
HOW TO USE
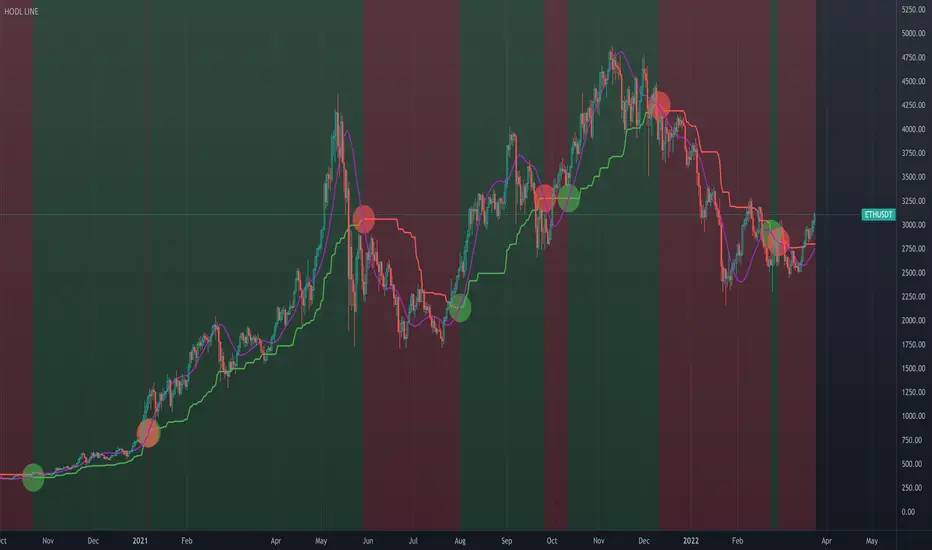
The step-like line is the main trend filter. It is colored green in an uptrend and red in a downtrend. When the smoothing is on, in addition to the trend filter, the indicator plots a purple line. It is a Hull Moving Average (HMA) of the price. In this case, the indicator uses this line instead of the price to find crossings with the trend filter.
When the price or the smoothed line crosses the trend filter above, it is an uptrend signal. The indicator marks such crossings with green circles. It also colors the chart background green in an uptrend. The price or the purple line crossing the trend filter below means a downtrend signal. Downtrend signals show as red circles. The chart background in a downtrend turns red.
SETTINGS
Sensitivity – a dropdown list that allows the user to choose an averaging period of the indicator. Users can select a value for sensitivity from a predetermined set that better suits their investment horizon.
Use Smoothing – turns on and off smoothing of the price with HMA. With the smoothing turned on, the indicator responds slower to price changes, but at the same time produces less amount of false signals.
Technically, the indicator is an asymmetric trend filter aimed to account for the fact that market sell-offs tend to be sharper than up-trends. The algorithm has two regimes – with and without price smoothing.
HOW TO USE
The step-like line is the main trend filter. It is colored green in an uptrend and red in a downtrend. When the smoothing is on, in addition to the trend filter, the indicator plots a purple line. It is a Hull Moving Average (HMA) of the price. In this case, the indicator uses this line instead of the price to find crossings with the trend filter.
When the price or the smoothed line crosses the trend filter above, it is an uptrend signal. The indicator marks such crossings with green circles. It also colors the chart background green in an uptrend. The price or the purple line crossing the trend filter below means a downtrend signal. Downtrend signals show as red circles. The chart background in a downtrend turns red.
SETTINGS
Sensitivity – a dropdown list that allows the user to choose an averaging period of the indicator. Users can select a value for sensitivity from a predetermined set that better suits their investment horizon.
Use Smoothing – turns on and off smoothing of the price with HMA. With the smoothing turned on, the indicator responds slower to price changes, but at the same time produces less amount of false signals.
오픈 소스 스크립트
트레이딩뷰의 진정한 정신에 따라, 이 스크립트의 작성자는 이를 오픈소스로 공개하여 트레이더들이 기능을 검토하고 검증할 수 있도록 했습니다. 작성자에게 찬사를 보냅니다! 이 코드는 무료로 사용할 수 있지만, 코드를 재게시하는 경우 하우스 룰이 적용된다는 점을 기억하세요.
Our premium trading indicators: unicorn.trading
Join our Discord community: dsc.gg/unicom
Join our Discord community: dsc.gg/unicom
면책사항
해당 정보와 게시물은 금융, 투자, 트레이딩 또는 기타 유형의 조언이나 권장 사항으로 간주되지 않으며, 트레이딩뷰에서 제공하거나 보증하는 것이 아닙니다. 자세한 내용은 이용 약관을 참조하세요.