OPEN-SOURCE SCRIPT
POC Indicator
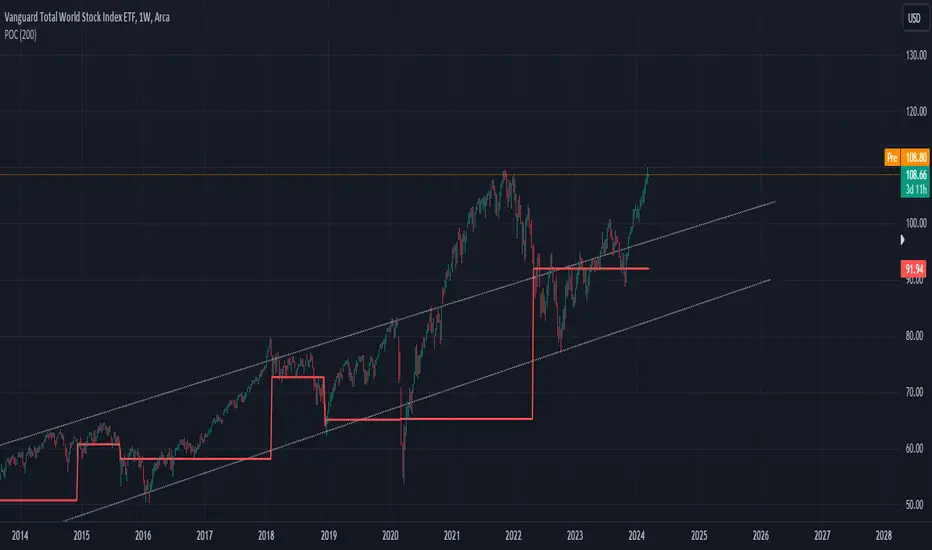
This simplified Point of Control (POC) indicator for TradingView is designed to identify and plot the price level where the highest volume of trading occurred over a specified period. The script works as follows:
Input and Initialization: The user specifies a length for the analysis period. Variables highestVolPrice and highestVol are initialized to track the price with the highest volume and the highest volume encountered, respectively.
Volume Analysis Loop: For each bar in the specified period (up to length bars back from the current bar), the script compares the volume of the current bar (volume) to highestVol. If the current bar's volume is higher, highestVol and highestVolPrice are updated to reflect the volume and closing price of the current bar.
Plotting the POC: Instead of using a horizontal line (hline), which cannot be dynamically updated within the loop, the script uses plot to draw the POC. This plotting function draws a line on the chart that represents the closing price level associated with the highest volume observed within the analysis period.
Resetting Variables: To ensure the indicator updates correctly with each new bar, the script resets highestVol and highestVolPrice at the start of the analysis for each new period. This step is designed to recalculate the POC dynamically as new data comes in.
This approach offers a basic method for visualizing significant price levels where substantial trading activity occurred, potentially indicating areas of strong support or resistance. However, it's a simplified model and does not calculate the true POC based on a detailed volume profile across all price levels within the period.
오픈 소스 스크립트
트레이딩뷰의 진정한 정신에 따라, 이 스크립트의 작성자는 이를 오픈소스로 공개하여 트레이더들이 기능을 검토하고 검증할 수 있도록 했습니다. 작성자에게 찬사를 보냅니다! 이 코드는 무료로 사용할 수 있지만, 코드를 재게시하는 경우 하우스 룰이 적용된다는 점을 기억하세요.
면책사항
해당 정보와 게시물은 금융, 투자, 트레이딩 또는 기타 유형의 조언이나 권장 사항으로 간주되지 않으며, 트레이딩뷰에서 제공하거나 보증하는 것이 아닙니다. 자세한 내용은 이용 약관을 참조하세요.
오픈 소스 스크립트
트레이딩뷰의 진정한 정신에 따라, 이 스크립트의 작성자는 이를 오픈소스로 공개하여 트레이더들이 기능을 검토하고 검증할 수 있도록 했습니다. 작성자에게 찬사를 보냅니다! 이 코드는 무료로 사용할 수 있지만, 코드를 재게시하는 경우 하우스 룰이 적용된다는 점을 기억하세요.
면책사항
해당 정보와 게시물은 금융, 투자, 트레이딩 또는 기타 유형의 조언이나 권장 사항으로 간주되지 않으며, 트레이딩뷰에서 제공하거나 보증하는 것이 아닙니다. 자세한 내용은 이용 약관을 참조하세요.