PROTECTED SOURCE SCRIPT
Green to Red Money Rails by FlyingOceanTiger
Buy at green. Sell at red. Let the rails do the drawing.
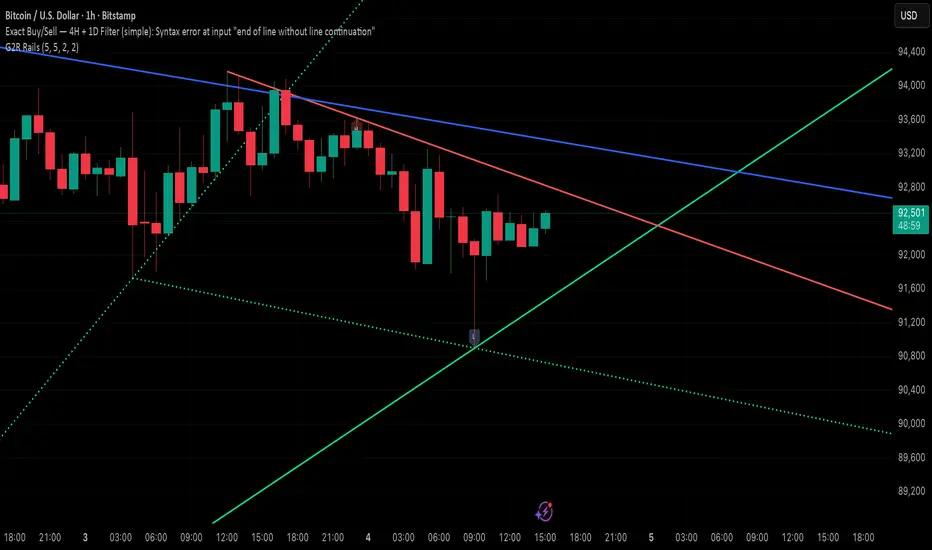
Green to Red Money Rails automatically draws rising green “money rails” from recent swing lows and a falling red resistance rail from recent swing highs.
Instead of manually hunting for trendlines on every chart and timeframe, this indicator finds the last three swing lows and last two swing highs and builds a clean fan of support plus one key resistance line for you.
How it works
• Uses pivot lows to build up-sloping green support fans (inner dotted rails + one solid base rail).
• Uses pivot highs to build a single down-sloping red resistance rail.
• Lines are time-anchored so they stay glued to price when you zoom or pan.
• Optional L / H labels show the latest swing low and swing high anchors.
Typical use case
• Trade a simple idea: “Buy near green support, take profit or fade at red resistance, avoid chasing breakouts.”
• Quickly map structure on any asset (crypto, stocks, forex) and any timeframe without redrawing trendlines.
Inputs & customization
• Pivot length for lows & highs (controls how “swingy” the pivots are).
• Toggle inner fans vs main base rail.
• Toggle pivot labels.
• Custom colors & line widths for green and red rails.
Important disclaimer
This is not a buy/sell signal by itself. It’s a visual tool to speed up your trendline workflow. Always combine it with your own risk management and confirmation (price action, volume, higher-timeframe context, etc.). Nothing here is financial advice.
보호된 스크립트입니다
이 스크립트는 비공개 소스로 게시됩니다. 하지만 이를 자유롭게 제한 없이 사용할 수 있습니다 – 자세한 내용은 여기에서 확인하세요.
면책사항
해당 정보와 게시물은 금융, 투자, 트레이딩 또는 기타 유형의 조언이나 권장 사항으로 간주되지 않으며, 트레이딩뷰에서 제공하거나 보증하는 것이 아닙니다. 자세한 내용은 이용 약관을 참조하세요.
보호된 스크립트입니다
이 스크립트는 비공개 소스로 게시됩니다. 하지만 이를 자유롭게 제한 없이 사용할 수 있습니다 – 자세한 내용은 여기에서 확인하세요.
면책사항
해당 정보와 게시물은 금융, 투자, 트레이딩 또는 기타 유형의 조언이나 권장 사항으로 간주되지 않으며, 트레이딩뷰에서 제공하거나 보증하는 것이 아닙니다. 자세한 내용은 이용 약관을 참조하세요.