OPEN-SOURCE SCRIPT
1337 Volume
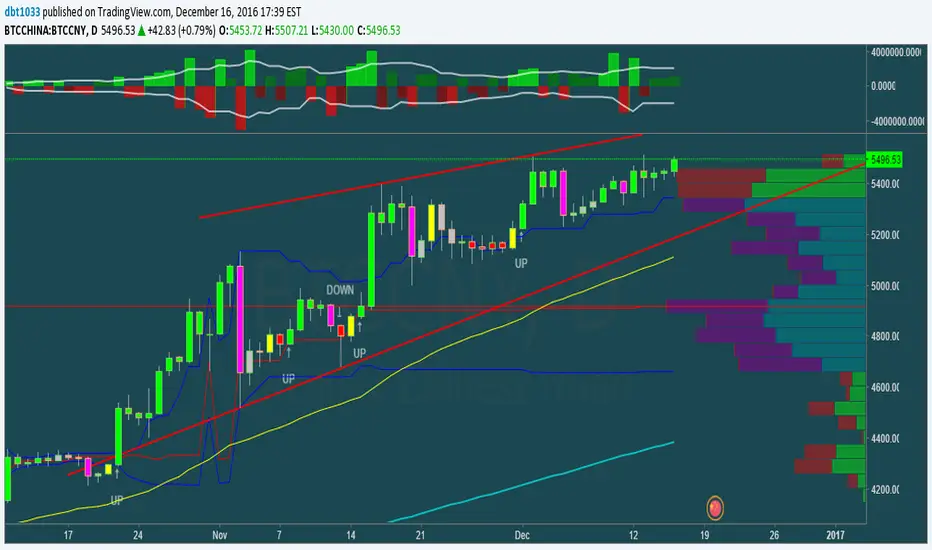
This volume indicator gives you a unique perspective and ability to analyze volume in any market. The upper line that is always >=0 represents average up volume over a user definable period while the lower line that is always <= 0 represents the average down volume over a user definable period.
green == bullish candle but volume lower than average
lime == bullish candle with above average volume
crimson == bearish candle with below average volume
red == bearish candle with above average volume
This indicator is very useful for spotting bottoms / tops (do a visual backtest and observe its behavior) as well as entry opportunities.
By default, the lookback period for average volume is 7, but I encourage you to change this value in order to find settings that work best for your particular market.
If you have any feedback or ideas for improvement, please comment.
Enjoy :D
오픈 소스 스크립트
트레이딩뷰의 진정한 정신에 따라, 이 스크립트의 작성자는 이를 오픈소스로 공개하여 트레이더들이 기능을 검토하고 검증할 수 있도록 했습니다. 작성자에게 찬사를 보냅니다! 이 코드는 무료로 사용할 수 있지만, 코드를 재게시하는 경우 하우스 룰이 적용된다는 점을 기억하세요.
면책사항
해당 정보와 게시물은 금융, 투자, 트레이딩 또는 기타 유형의 조언이나 권장 사항으로 간주되지 않으며, 트레이딩뷰에서 제공하거나 보증하는 것이 아닙니다. 자세한 내용은 이용 약관을 참조하세요.
오픈 소스 스크립트
트레이딩뷰의 진정한 정신에 따라, 이 스크립트의 작성자는 이를 오픈소스로 공개하여 트레이더들이 기능을 검토하고 검증할 수 있도록 했습니다. 작성자에게 찬사를 보냅니다! 이 코드는 무료로 사용할 수 있지만, 코드를 재게시하는 경우 하우스 룰이 적용된다는 점을 기억하세요.
면책사항
해당 정보와 게시물은 금융, 투자, 트레이딩 또는 기타 유형의 조언이나 권장 사항으로 간주되지 않으며, 트레이딩뷰에서 제공하거나 보증하는 것이 아닙니다. 자세한 내용은 이용 약관을 참조하세요.