OPEN-SOURCE SCRIPT
업데이트됨 VWAP From Multiple Sources With Cloud & Percentage Gap
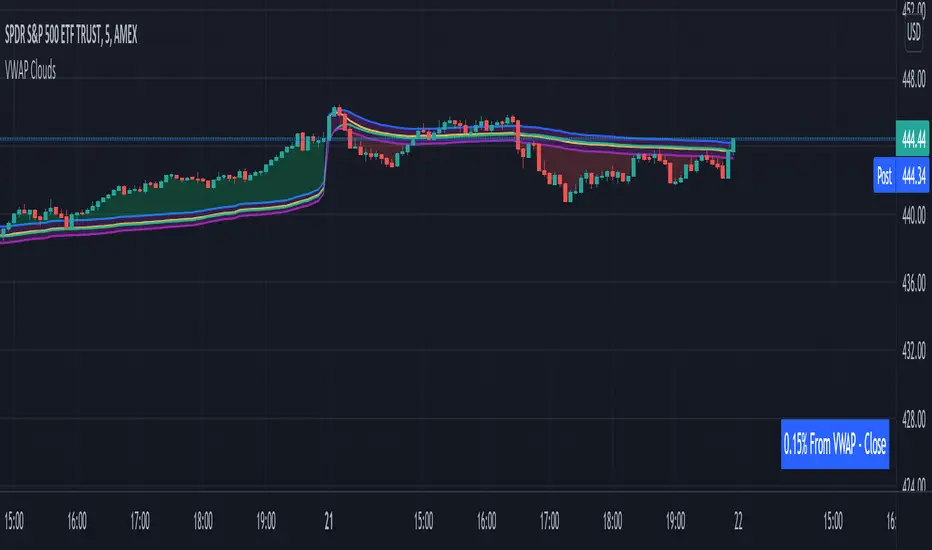
VWAP CLOUD FROM CLOSE, OPEN, HIGH & LOW SOURCES WITH CLOUD & PERCENTAGE GAP
VWAP stands for volume weighted average price and shows the average price of buys/sells based on volume traded across the current session. This VWAP is based off of the Daily session.
***HOW TO USE***
Use the purple cloud between the VWAPs as your entry points as price will typically bounce from that cloud area.
The Yellow Line is the VWAP using the close price as a source.
The Green Line is the VWAP using the open price as a source.
The Blue Line is the VWAP using the high price as a source.
The Purple Line is the VWAP using the low price as a source.
When price is above the VWAP cloud, the background will paint green because the trend is bullish.
When price is below the VWAP cloud, the background will paint red because the trend is bearish.
In the bottom right hand corner, three is a table that will show you the current percentage gap between current price and the VWAP using close as the source.
All sources and colors can be easily switched in the settings menu.
***MARKETS***
This indicator can be used as a signal on all markets, including stocks, crypto, futures and forex.
***TIMEFRAMES***
This vwap indicator can be used on all timeframes but is calculated using the daily session.
***TIPS***
Try using numerous indicators of ours on your chart so you can instantly see the bullish or bearish trend of multiple indicators in real time without having to analyze the data. Some of our favorites are our Auto Fibonacci, Volume Profile, Directional Movement Index, Momentum, Auto Support And Resistance and Money Flow Index in combination with this VWAP Cloud. The other indicators all have real time Bullish and Bearish labels as well so you can immediately understand each indicator's trend.
릴리즈 노트
Added the ability to turn the bull/bear label on or off for better viewing on the mobile app or users that don't want the label.오픈 소스 스크립트
트레이딩뷰의 진정한 정신에 따라, 이 스크립트의 작성자는 이를 오픈소스로 공개하여 트레이더들이 기능을 검토하고 검증할 수 있도록 했습니다. 작성자에게 찬사를 보냅니다! 이 코드는 무료로 사용할 수 있지만, 코드를 재게시하는 경우 하우스 룰이 적용된다는 점을 기억하세요.
Trend Friend - Data Driven Trading Indicators For All Your Favorite Markets
Get Access To Our Premium Indicator Suite -> friendofthetrend.com/
Join Our Trading Group - facebook.com/groups/stockandcryptotradingstrategies
Get Access To Our Premium Indicator Suite -> friendofthetrend.com/
Join Our Trading Group - facebook.com/groups/stockandcryptotradingstrategies
면책사항
해당 정보와 게시물은 금융, 투자, 트레이딩 또는 기타 유형의 조언이나 권장 사항으로 간주되지 않으며, 트레이딩뷰에서 제공하거나 보증하는 것이 아닙니다. 자세한 내용은 이용 약관을 참조하세요.
오픈 소스 스크립트
트레이딩뷰의 진정한 정신에 따라, 이 스크립트의 작성자는 이를 오픈소스로 공개하여 트레이더들이 기능을 검토하고 검증할 수 있도록 했습니다. 작성자에게 찬사를 보냅니다! 이 코드는 무료로 사용할 수 있지만, 코드를 재게시하는 경우 하우스 룰이 적용된다는 점을 기억하세요.
Trend Friend - Data Driven Trading Indicators For All Your Favorite Markets
Get Access To Our Premium Indicator Suite -> friendofthetrend.com/
Join Our Trading Group - facebook.com/groups/stockandcryptotradingstrategies
Get Access To Our Premium Indicator Suite -> friendofthetrend.com/
Join Our Trading Group - facebook.com/groups/stockandcryptotradingstrategies
면책사항
해당 정보와 게시물은 금융, 투자, 트레이딩 또는 기타 유형의 조언이나 권장 사항으로 간주되지 않으며, 트레이딩뷰에서 제공하거나 보증하는 것이 아닙니다. 자세한 내용은 이용 약관을 참조하세요.