PROTECTED SOURCE SCRIPT
Sumon Pal Volume Osc
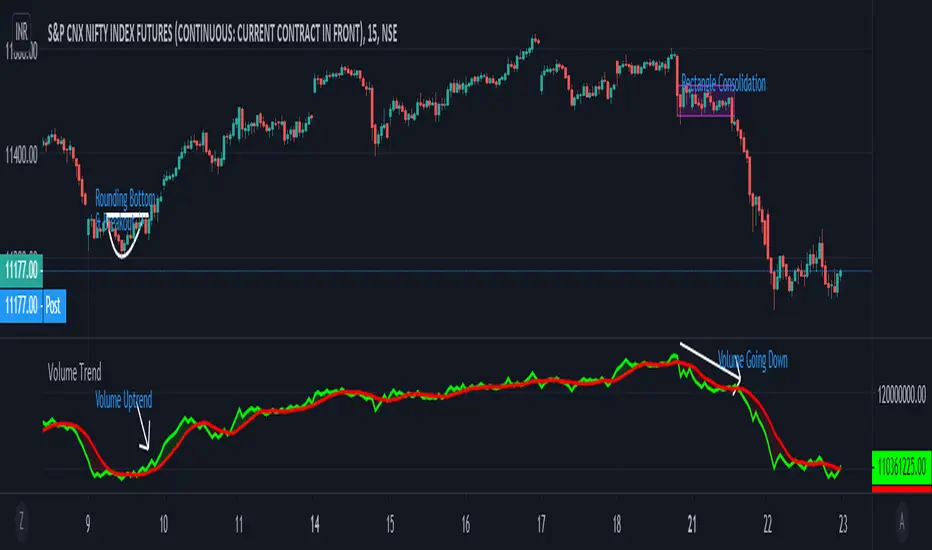
This is a volume oscillator calculated by the volume action on each bar price movement over a period of time.
When the short term volume(green line) is above the long term volume line(red)it indicates volume is coming and buying pressure may be observed.
Similarly when the short term volume is below the long term, volume is getting liquidated and selling pressure may be observed.
This indicator alone can't be used for buying or selling decision. This indicator can be used along with price action break out or break down level to get an idea whether volume is supporting the break out/down or not.
Disclaimer: Backtest this indicator with price action over a period of time and understand how it works before taking any trading decision. Trading in equity is always risky. Asses your risk profile and trade by managing proper risk.
보호된 스크립트입니다
이 스크립트는 비공개 소스로 게시됩니다. 하지만 이를 자유롭게 제한 없이 사용할 수 있습니다 – 자세한 내용은 여기에서 확인하세요.
면책사항
해당 정보와 게시물은 금융, 투자, 트레이딩 또는 기타 유형의 조언이나 권장 사항으로 간주되지 않으며, 트레이딩뷰에서 제공하거나 보증하는 것이 아닙니다. 자세한 내용은 이용 약관을 참조하세요.
면책사항
해당 정보와 게시물은 금융, 투자, 트레이딩 또는 기타 유형의 조언이나 권장 사항으로 간주되지 않으며, 트레이딩뷰에서 제공하거나 보증하는 것이 아닙니다. 자세한 내용은 이용 약관을 참조하세요.