PROTECTED SOURCE SCRIPT
업데이트됨 USD Volume
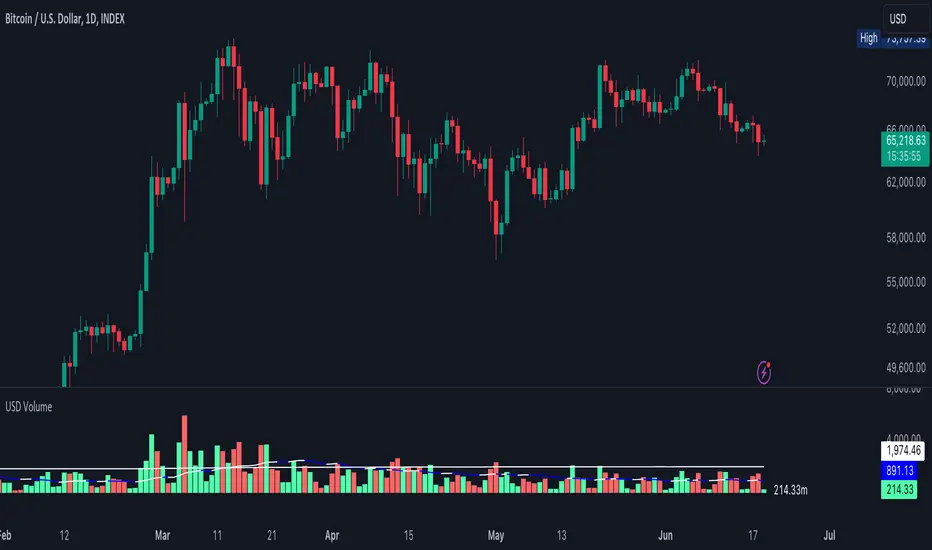
A volume tool but the candles represent Volume in USD Format which is usually
here are some examples of what the numbers represent on the right-hand side.
.01 = $10,000
.5 = $500,000
1 = $1,000,000
50 = $50,000,000
250 = $250,000,000
1000 = $1,000,000,000
The lower line is the "Average Volume" based on lifetime history. Anytime volume is below average, this likely denotes most people have capitulated or the markets have grown bored at these price ranges. A squeeze in volume primes the asset for a big move.
The upper line is the 3rd standard of Deviation from the average line. Anytime volume touches that line or goes higher, this denotes its a very big move relative to how the asset typically trades. If the volume stays above this range for an extended period of time, it would be wise to watch the chart closely and start taking profits off the table whether you're shorting or longing the asset.
릴리즈 노트
Added: 1. Feature to Choose Average Volume line over a Specified Period
2. Label at the end of the volume that denotes the last period's volume
Changed:
The colors of the Average Line.
White = Increasing Volume
Blue = Decreasing Volume
릴리즈 노트
Added: 1. Choose periods you want your average volume to show.
2. A label to the right of the latest volume bar to show the USD Value
Changed:
Colors of average line.
White = Volume increasing
Blue = Volume decreasing
Top white line = 3rd standard of deviation from the average
보호된 스크립트입니다
이 스크립트는 비공개 소스로 게시됩니다. 하지만 이를 자유롭게 제한 없이 사용할 수 있습니다 – 자세한 내용은 여기에서 확인하세요.
면책사항
해당 정보와 게시물은 금융, 투자, 트레이딩 또는 기타 유형의 조언이나 권장 사항으로 간주되지 않으며, 트레이딩뷰에서 제공하거나 보증하는 것이 아닙니다. 자세한 내용은 이용 약관을 참조하세요.
보호된 스크립트입니다
이 스크립트는 비공개 소스로 게시됩니다. 하지만 이를 자유롭게 제한 없이 사용할 수 있습니다 – 자세한 내용은 여기에서 확인하세요.
면책사항
해당 정보와 게시물은 금융, 투자, 트레이딩 또는 기타 유형의 조언이나 권장 사항으로 간주되지 않으며, 트레이딩뷰에서 제공하거나 보증하는 것이 아닙니다. 자세한 내용은 이용 약관을 참조하세요.