PROTECTED SOURCE SCRIPT
RBX - OBV MACD
OBV (On-Balance Volume) is a technical indicator that measures the momentum of buying and selling pressure in a market based on the volume of trades. It uses a cumulative total of volume traded during periods of price increases and decreases to determine the overall trend. When prices rise, OBV increases, and when prices fall, OBV decreases.
The enhanced version of OBV combines the traditional OBV formula with the MACD (Moving Average Convergence Divergence) indicator to provide more information about the momentum of the volume flow. The MACD is a trend-following momentum indicator that shows the relationship between two moving averages of price.
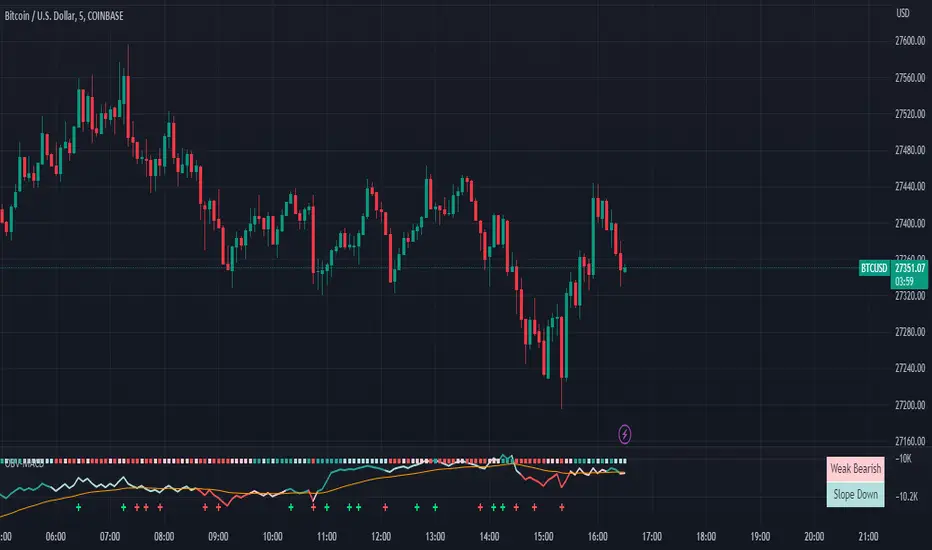
In the enhanced OBV with MACD, the top color in the OBV line indicates the quadrant of the MACD, with green indicating the first quadrant (positive value of MACD and increasing), red indicating the second quadrant (negative value of MACD and decreasing), magenta indicating the third quadrant (negative value of MACD and increasing), and cyan indicating the fourth quadrant (positive value of MACD and decreasing).
The top bar color in the enhanced OBV with MACD indicates the increasing or decreasing of the MACD histogram. A green bar indicates an increasing histogram, while a red bar indicates a decreasing histogram.
In addition, the plus bar sign in the enhanced OBV with MACD signifies that the OBV is making a new high or new low. This helps traders identify potential trend reversals or confirm the current trend.
Overall, the enhanced OBV with MACD provides traders with more information about the momentum of volume flow and potential trend reversals, making it a useful tool for technical analysis in trading.
The enhanced version of OBV combines the traditional OBV formula with the MACD (Moving Average Convergence Divergence) indicator to provide more information about the momentum of the volume flow. The MACD is a trend-following momentum indicator that shows the relationship between two moving averages of price.
In the enhanced OBV with MACD, the top color in the OBV line indicates the quadrant of the MACD, with green indicating the first quadrant (positive value of MACD and increasing), red indicating the second quadrant (negative value of MACD and decreasing), magenta indicating the third quadrant (negative value of MACD and increasing), and cyan indicating the fourth quadrant (positive value of MACD and decreasing).
The top bar color in the enhanced OBV with MACD indicates the increasing or decreasing of the MACD histogram. A green bar indicates an increasing histogram, while a red bar indicates a decreasing histogram.
In addition, the plus bar sign in the enhanced OBV with MACD signifies that the OBV is making a new high or new low. This helps traders identify potential trend reversals or confirm the current trend.
Overall, the enhanced OBV with MACD provides traders with more information about the momentum of volume flow and potential trend reversals, making it a useful tool for technical analysis in trading.
보호된 스크립트입니다
이 스크립트는 비공개 소스로 게시됩니다. 하지만 이를 자유롭게 제한 없이 사용할 수 있습니다 – 자세한 내용은 여기에서 확인하세요.
면책사항
해당 정보와 게시물은 금융, 투자, 트레이딩 또는 기타 유형의 조언이나 권장 사항으로 간주되지 않으며, 트레이딩뷰에서 제공하거나 보증하는 것이 아닙니다. 자세한 내용은 이용 약관을 참조하세요.
면책사항
해당 정보와 게시물은 금융, 투자, 트레이딩 또는 기타 유형의 조언이나 권장 사항으로 간주되지 않으며, 트레이딩뷰에서 제공하거나 보증하는 것이 아닙니다. 자세한 내용은 이용 약관을 참조하세요.