OPEN-SOURCE SCRIPT
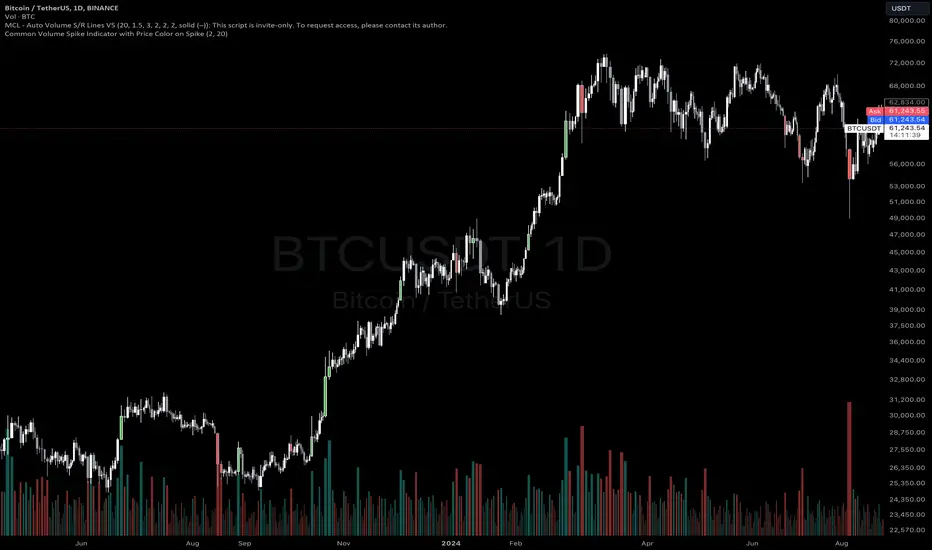
Common Volume Spike Indicator with Price Color on Spike
Indicator Name: Common Volume Spike Indicator with Price Color on Spike
Description:
The “Common Volume Spike Indicator with Price Color on Spike” is designed to detect significant volume spikes and highlight them on the chart. It not only identifies moments when the trading volume exceeds a certain threshold but also colors the price bars based on price movement during these spikes.
Key Features:
• Volume Spike Detection: Detects volume spikes when the current volume exceeds a specified multiple of the average volume over a user-defined lookback period.
• Dynamic Volume Break: Highlights bars where the volume exceeds a threshold, dynamically calculated as a multiple of the average volume (default is 10x the average volume).
• Price Color on Volume Spike: When a volume spike occurs, bars are colored green if the price closes higher than the previous bar, and red if the price closes lower. This feature helps traders easily identify significant price movements during high-volume periods.
• Customizable Parameters:
• Threshold Multiplier: Adjust the sensitivity of volume spike detection.
• Lookback Period: Define the period over which the average volume is calculated.
• Volume Break Multiplier: Set a multiplier for the average volume to identify extreme volume breaks.
This indicator is suitable for traders who want to quickly spot critical market events driven by significant increases in volume. It helps to visualize both the volume activity and the corresponding price movement, providing an additional layer of market insight.
How to Use:
1. Green Bars: When the volume spike condition is met and the price closes higher than the previous bar, the bar is colored green.
2. Red Bars: When the volume spike condition is met and the price closes lower than the previous bar, the bar is colored red.
3. Blue Bars: Indicates a significant volume break, where the current volume exceeds a specified multiple of the average volume (default: 10x).
Ideal for intraday and swing traders who rely on volume and price action for market entries and exits. This indicator works well across different asset classes, including stocks, forex, and cryptocurrencies.
You can adjust the input parameters to fit your specific trading strategy and timeframe.
Disclaimer: This indicator is a tool to help with market analysis and should not be considered financial advice. Always perform your own due diligence before making any trading decisions.
This description outlines the key functionality and how the indicator can benefit traders on TradingView.
오픈 소스 스크립트
트레이딩뷰의 진정한 정신에 따라, 이 스크립트의 작성자는 이를 오픈소스로 공개하여 트레이더들이 기능을 검토하고 검증할 수 있도록 했습니다. 작성자에게 찬사를 보냅니다! 이 코드는 무료로 사용할 수 있지만, 코드를 재게시하는 경우 하우스 룰이 적용된다는 점을 기억하세요.
면책사항
해당 정보와 게시물은 금융, 투자, 트레이딩 또는 기타 유형의 조언이나 권장 사항으로 간주되지 않으며, 트레이딩뷰에서 제공하거나 보증하는 것이 아닙니다. 자세한 내용은 이용 약관을 참조하세요.
오픈 소스 스크립트
트레이딩뷰의 진정한 정신에 따라, 이 스크립트의 작성자는 이를 오픈소스로 공개하여 트레이더들이 기능을 검토하고 검증할 수 있도록 했습니다. 작성자에게 찬사를 보냅니다! 이 코드는 무료로 사용할 수 있지만, 코드를 재게시하는 경우 하우스 룰이 적용된다는 점을 기억하세요.
면책사항
해당 정보와 게시물은 금융, 투자, 트레이딩 또는 기타 유형의 조언이나 권장 사항으로 간주되지 않으며, 트레이딩뷰에서 제공하거나 보증하는 것이 아닙니다. 자세한 내용은 이용 약관을 참조하세요.