PROTECTED SOURCE SCRIPT
Relative Volatility Oscillator
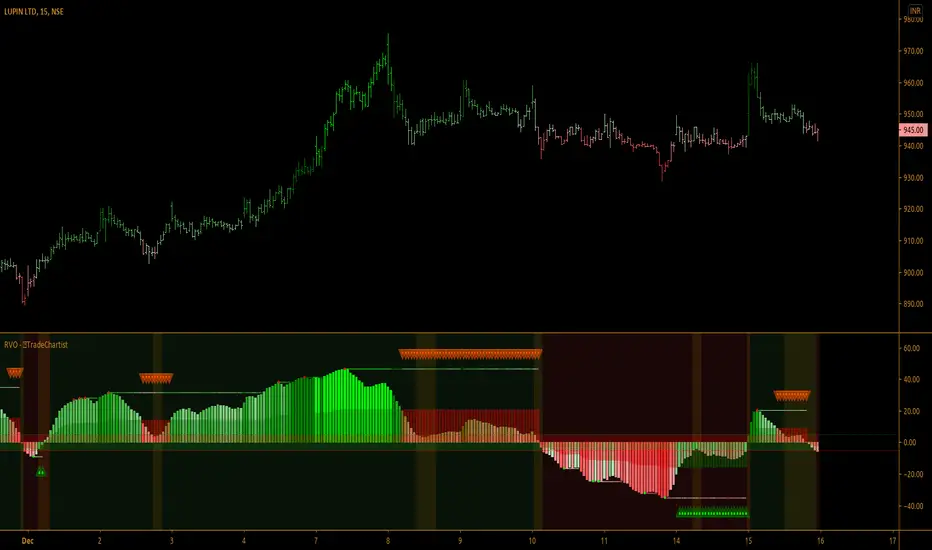
Relative Volatility Oscillator is a volatility based oscillator and works very well on Lower Time Frames on volatile assets. It uses one of five periods (34,55,89,144,233) to calculate relative volatility of the current bar with the volatility trend of one of the 5 periods from the settings, using percentile rank.
Features of Relative Volatility Oscillator
Features of Relative Volatility Oscillator
- Choice of one of five periods for the Relative Volatility Oscillator plot.
- SOS Triangles to indicate Bull/Bear Exhaustion.
- Option to plot Volatility Zones. Oscillator Values between -5 and 5 will be plotted using exhaustion colours and can be used to monitor trades closely for trend reversals.
- Choice of 3 colour themes including option to plot trend based coloured price bars.
보호된 스크립트입니다
이 스크립트는 비공개 소스로 게시됩니다. 하지만 이를 자유롭게 제한 없이 사용할 수 있습니다 – 자세한 내용은 여기에서 확인하세요.
Get in touch with me if you would like access to my Premium scripts for a trial before deciding on lifetime access.
Telegram - @Trade_Chartist
Free Scripts - bit.ly/Free-Scripts
Telegram - @Trade_Chartist
Free Scripts - bit.ly/Free-Scripts
면책사항
해당 정보와 게시물은 금융, 투자, 트레이딩 또는 기타 유형의 조언이나 권장 사항으로 간주되지 않으며, 트레이딩뷰에서 제공하거나 보증하는 것이 아닙니다. 자세한 내용은 이용 약관을 참조하세요.