PROTECTED SOURCE SCRIPT
업데이트됨 SD Trend with Signals
SD Trend Indicator
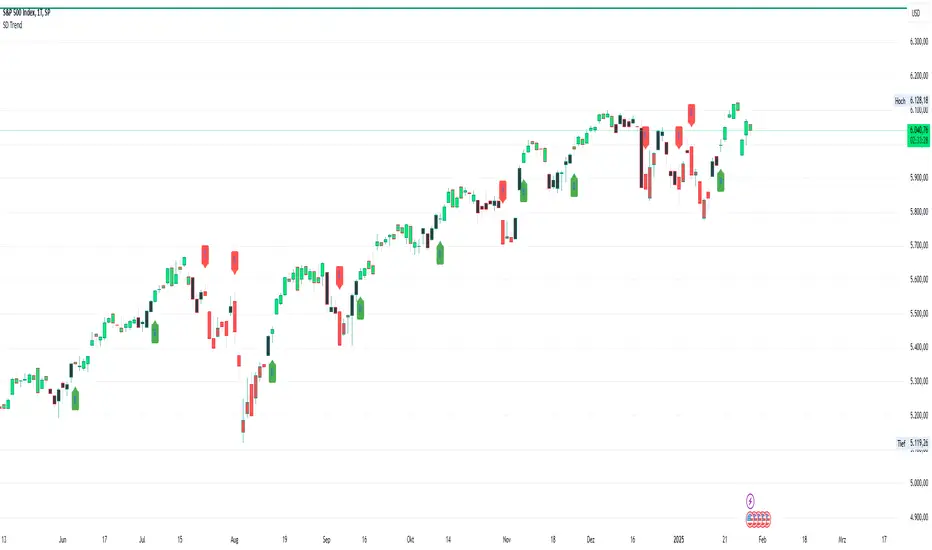
The SD Trend Indicator is a trend-following tool designed to help traders identify potential buy and sell signals based on a combination of technical indicators: MACD, RSI, and Stochastic Oscillator. It visually enhances price action by color-coding candles and plotting signals when a trend shift occurs.
How It Works:
MACD (12, 26, 9): Measures momentum and trend direction.
RSI (7): Identifies overbought and oversold conditions.
Stochastic Oscillator (14, 3, 3): Confirms trend strength and reversals.
Candle Color Coding:
Green → Bullish (Buy Condition)
Red → Bearish (Sell Condition)
Black → Neutral (No Trade)
Signal Generation:
A Buy Signal (B) is plotted below the first green candle after a neutral (black) phase.
A Sell Signal (S) is plotted above the first red candle after a neutral (black) phase.
This helps traders capture early trend reversals with clear visual confirmation.
Key Features:
✔️ Trend Confirmation using three proven indicators.
✔️ Clear Candle Coloring for easy trend visualization.
✔️ Buy/Sell Labels (B/S) for quick decision-making.
✔️ Works on any timeframe and asset class (stocks, forex, crypto, etc.).
This indicator is ideal for traders looking to follow trends, identify potential reversals, and improve entry/exit timing with a systematic approach
릴리즈 노트
SD Trend IndicatorThe SD Trend Indicator is a trend-following tool designed to help traders identify potential buy and sell signals based on a combination of technical indicators: MACD, RSI, and Stochastic Oscillator. It visually enhances price action by color-coding candles and plotting signals when a trend shift occurs.
How It Works:
MACD (12, 26, 9): Measures momentum and trend direction.
RSI (7): Identifies overbought and oversold conditions.
Stochastic Oscillator (14, 3, 3): Confirms trend strength and reversals.
Candle Color Coding:
Green → Bullish (Buy Condition)
Red → Bearish (Sell Condition)
Black → Neutral (No Trade)
Signal Generation:
A Buy Signal (B) is plotted below the first green candle after a neutral (black) phase.
A Sell Signal (S) is plotted above the first red candle after a neutral (black) phase.
This helps traders capture early trend reversals with clear visual confirmation.
Key Features:
✔️ Trend Confirmation using three proven indicators.
✔️ Clear Candle Coloring for easy trend visualization.
✔️ Buy/Sell Labels (B/S) for quick decision-making.
✔️ Works on any timeframe and asset class (stocks, forex, crypto, etc.).
This indicator is ideal for traders looking to follow trends, identify potential reversals, and improve entry/exit timing with a systematic approach
***UPDATE***
- updated to pine script version 6.0
- new alarm function to set alarms every time a new green candle is plotted!
보호된 스크립트입니다
이 스크립트는 비공개 소스로 게시됩니다. 하지만 이를 자유롭게 제한 없이 사용할 수 있습니다 – 자세한 내용은 여기에서 확인하세요.
면책사항
해당 정보와 게시물은 금융, 투자, 트레이딩 또는 기타 유형의 조언이나 권장 사항으로 간주되지 않으며, 트레이딩뷰에서 제공하거나 보증하는 것이 아닙니다. 자세한 내용은 이용 약관을 참조하세요.
면책사항
해당 정보와 게시물은 금융, 투자, 트레이딩 또는 기타 유형의 조언이나 권장 사항으로 간주되지 않으며, 트레이딩뷰에서 제공하거나 보증하는 것이 아닙니다. 자세한 내용은 이용 약관을 참조하세요.