INVITE-ONLY SCRIPT
[KICK] Ultimate ADXDMI
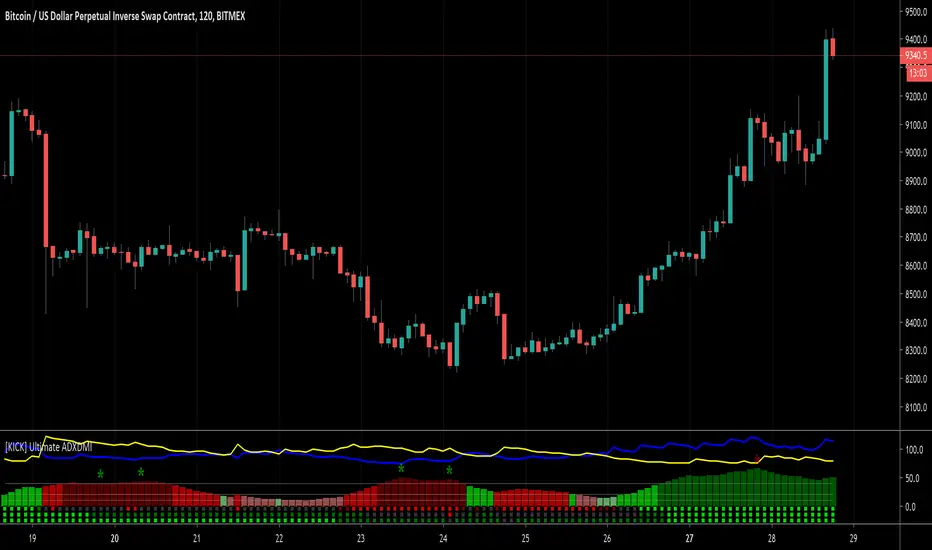
This indicator is a version of the ADX and DMI indicators optimized for maximum information conveyance related to trending price action in a compact space.
Use the ADX barchart to determine strength of trend. There are various configurable thresholds for this measurement as well as peak marking within the exhaustion zone. The higher the values in the bar chart, the stronger the trend. Low values indicate non-trending or choppy price action.
Use the DMI line graphs (as well as the color codes on the ADX barchart) to determine trending direction. You can offset the DI+ and DI- lines so that they are not directly on top of the ADX chart. When the DI+ is on top (blue line by default) the trend is up and when the DI- line (yellow by default) is on top the trend is down. The colors of the ADX chart also indicate direction with red indicating down and green indicating up. The "pale" shades indicate a nacent/immature trend, "bright" shades indicate a solid trend, and the "darker" shades indicate a strong trend that is mature. Look for these mature trends to "top out" and have their peaks marked when the trend has exhausted itself (note that the peak indicators will repaint 1-2 candles in the past after the "high" is confirmed).
You can specify up to 3 additional timeframes to monitor in the dot map below the ADX chart that will give you a generalized idea of the trend on those larger timeframes. In these heat maps, the color red indicates a down trend and green an up trend. The brighter colors denote strong trends while the darker colors are weaker. Grey dots in the heat map indicate no strong trend present. Some users actually prefer to turn off the main ADX and DMI visualizations and only display the multi-timeframe heatmap as a way of checking higher timeframe trends before entering their trades.
Use the link below to watch a tutorial video, request a trial, or purchase for access.
초대 전용 스크립트
이 스크립트는 작성자가 승인한 사용자만 접근할 수 있습니다. 사용하려면 요청 후 승인을 받아야 하며, 일반적으로 결제 후에 허가가 부여됩니다. 자세한 내용은 아래 작성자의 안내를 따르거나 CryptoKick에게 직접 문의하세요.
트레이딩뷰는 스크립트의 작동 방식을 충분히 이해하고 작성자를 완전히 신뢰하지 않는 이상, 해당 스크립트에 비용을 지불하거나 사용하는 것을 권장하지 않습니다. 커뮤니티 스크립트에서 무료 오픈소스 대안을 찾아보실 수도 있습니다.
작성자 지시 사항
Visit Kick Studios for access to our paid and FREE indicators
kickstudios.com/tools
PineScript Indicator Development course
kickstudios.com/courses
Trading Discord Community (Apex Trades)
discord.gg/K5hFQKHaKr
kickstudios.com/tools
PineScript Indicator Development course
kickstudios.com/courses
Trading Discord Community (Apex Trades)
discord.gg/K5hFQKHaKr
면책사항
해당 정보와 게시물은 금융, 투자, 트레이딩 또는 기타 유형의 조언이나 권장 사항으로 간주되지 않으며, 트레이딩뷰에서 제공하거나 보증하는 것이 아닙니다. 자세한 내용은 이용 약관을 참조하세요.