OPEN-SOURCE SCRIPT
Fixed Volatility Oscillator
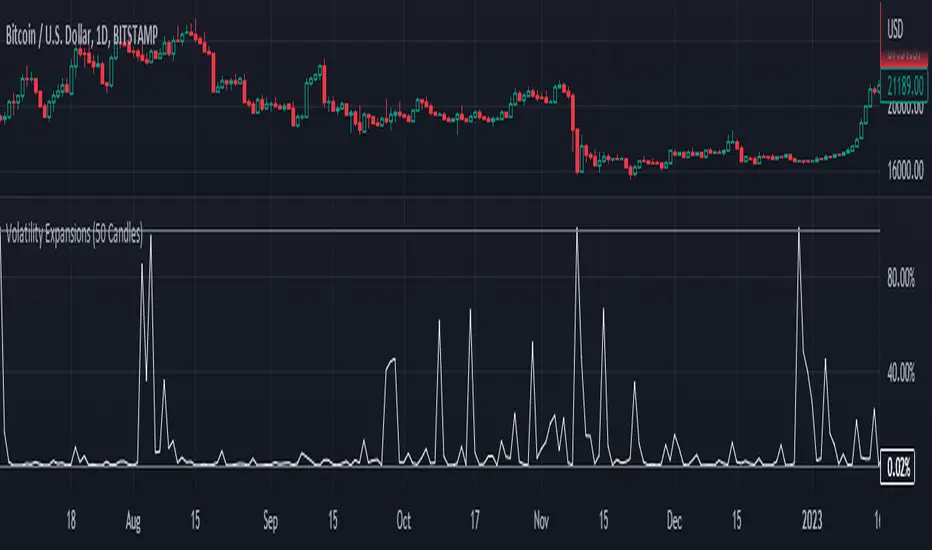
A fixed volatility plotter set to a 0-100 range - Plots the current volatility % using the formula to calculate volatility and stdev (standard deviation) based on the candle lookback.
The indicator is Fixed, which means that regardless of the chart, the volatility will be plotted on a percentage of 0% - 100% with a 101% threshold set to indicate a volatility reset. While the volume of volatility will change depending on the chart, the volatility will ALWAYS stay within this range.
if a plot exceeds 100% it should be marked as volatility reset - not an expansion
and should also be noted that the volatility spikes are also very inconsistent in volume and vary greatly.
The candle lookbacks on standard are organized be from 10 candles to 100 candles. I found the best results using the 50 candles lookback, and therefore have set it as the default value. These different values can be used to pull the information from the # of candles on the selected option - and therefore the volatility will be calculated from the number of candles selected.
// note for other people versed in pinescript
While this indicator may be useful in trading or strategies, it is more meant to incorporated into other scripts or used as a basis that can be further expanded on. The visuals are not built at all - for that purpose.
This script has not been listed as a library for the fact that it can be used as an actual indicator within a strategy - hope you enjoy.
오픈 소스 스크립트
트레이딩뷰의 진정한 정신에 따라, 이 스크립트의 작성자는 이를 오픈소스로 공개하여 트레이더들이 기능을 검토하고 검증할 수 있도록 했습니다. 작성자에게 찬사를 보냅니다! 이 코드는 무료로 사용할 수 있지만, 코드를 재게시하는 경우 하우스 룰이 적용된다는 점을 기억하세요.
면책사항
해당 정보와 게시물은 금융, 투자, 트레이딩 또는 기타 유형의 조언이나 권장 사항으로 간주되지 않으며, 트레이딩뷰에서 제공하거나 보증하는 것이 아닙니다. 자세한 내용은 이용 약관을 참조하세요.
오픈 소스 스크립트
트레이딩뷰의 진정한 정신에 따라, 이 스크립트의 작성자는 이를 오픈소스로 공개하여 트레이더들이 기능을 검토하고 검증할 수 있도록 했습니다. 작성자에게 찬사를 보냅니다! 이 코드는 무료로 사용할 수 있지만, 코드를 재게시하는 경우 하우스 룰이 적용된다는 점을 기억하세요.
면책사항
해당 정보와 게시물은 금융, 투자, 트레이딩 또는 기타 유형의 조언이나 권장 사항으로 간주되지 않으며, 트레이딩뷰에서 제공하거나 보증하는 것이 아닙니다. 자세한 내용은 이용 약관을 참조하세요.