PROTECTED SOURCE SCRIPT
업데이트됨 Trend Performance Tracker
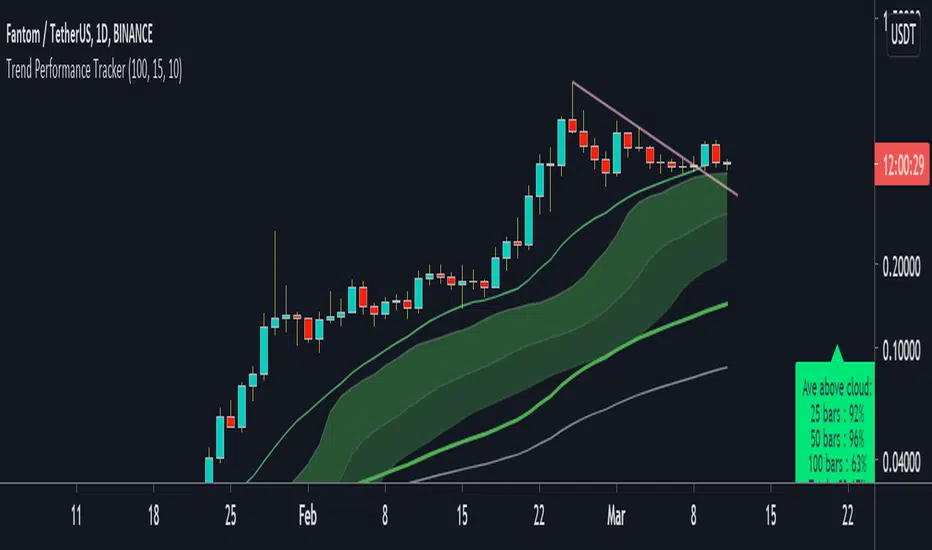
This script is designed for trend trading. Currently set up for stocks long. It's main aim is checking the profitability of the trend trading system that it suggests.
How to use:
- When there is a sufficient trend and pullback for an entry yellow dots will appear under the bars. An buy-stop line (green) and a stop-loss line (red) also appear on the chart at this point.
- the script tracks having made a trade and continues to draw the stop-loss placement on the chart (red line)
- at the bottom of the chart you an see the script tracking the trades it would place.
- Yellow squares are a pending setup
- A green arrow and green squares are a open position
- A pink X means a losing trade and a green flag means a winning trade
- At the current bar will be data on how well the strategy would perform on that pair at that timeframe. "RR" is the total RR made over the number of trades (a bad trade is counted as -1). "win %" is the percentage of winning trades.
- If there RR is > 2 and win % is > 50%, the data box will show as green, indicating a good probability for trading success on that pair and time-frame at that moment.
릴리즈 노트
Updated the study name to avoid confusion릴리즈 노트
Minor fix to entry릴리즈 노트
Updated the RR data box to be out of the way. The X axis bar placement can be set in the options too릴리즈 노트
Improved the stop-loss line rules릴리즈 노트
Improved trend data to include trend strength and added higher timeframe mas릴리즈 노트
Updated pullback rules릴리즈 노트
Updated stop loss to not kick out on the first candle릴리즈 노트
Updated to include short trend tracking릴리즈 노트
Fixed sell line update릴리즈 노트
Removed entry circles as were clutter릴리즈 노트
updated to show buy line at last 10 candles릴리즈 노트
Minor edit릴리즈 노트
cleaned up script릴리즈 노트
fixed some small details릴리즈 노트
Removes swing high line as not really useful보호된 스크립트입니다
이 스크립트는 비공개 소스로 게시됩니다. 하지만 이를 자유롭게 제한 없이 사용할 수 있습니다 – 자세한 내용은 여기에서 확인하세요.
면책사항
해당 정보와 게시물은 금융, 투자, 트레이딩 또는 기타 유형의 조언이나 권장 사항으로 간주되지 않으며, 트레이딩뷰에서 제공하거나 보증하는 것이 아닙니다. 자세한 내용은 이용 약관을 참조하세요.
보호된 스크립트입니다
이 스크립트는 비공개 소스로 게시됩니다. 하지만 이를 자유롭게 제한 없이 사용할 수 있습니다 – 자세한 내용은 여기에서 확인하세요.
면책사항
해당 정보와 게시물은 금융, 투자, 트레이딩 또는 기타 유형의 조언이나 권장 사항으로 간주되지 않으며, 트레이딩뷰에서 제공하거나 보증하는 것이 아닙니다. 자세한 내용은 이용 약관을 참조하세요.