OPEN-SOURCE SCRIPT
업데이트됨 RSI Moving Average Crossovers
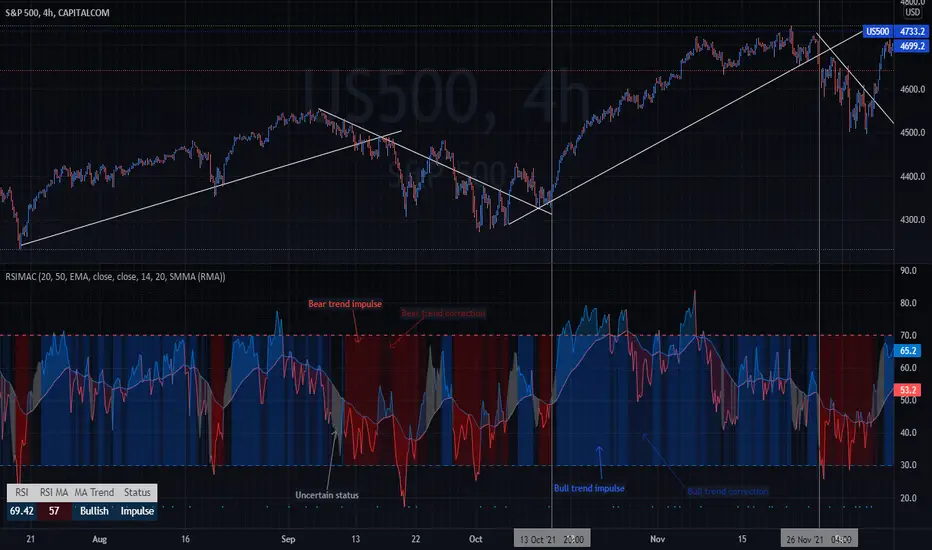
This script is an improved version of the RSI indicator, using a moving average on the RSI itself, as well as two other moving averages used to determine the current trend.
A small screener indicating the current movement is displayed in the bottom-left zone of the chart: trend (Bullish/Bearish/Uncertain) and status (Impulse or Correction)
Trends are simply based on moving averages crossovers, coupled to the fact that the current candle closes above the fast MA in a bull trend, and under the fast MA in a bear trend. In other cases, the trend and the movement are considered as "Uncertain" by the indicator.
Options
Defaults Parameters
Don't hesitate to suggest any idea which could improve this indicator.
A small screener indicating the current movement is displayed in the bottom-left zone of the chart: trend (Bullish/Bearish/Uncertain) and status (Impulse or Correction)
Trends are simply based on moving averages crossovers, coupled to the fact that the current candle closes above the fast MA in a bull trend, and under the fast MA in a bear trend. In other cases, the trend and the movement are considered as "Uncertain" by the indicator.
Options
- Various types of moving averages for the RSI and trend MA
- Show/Hide crossovers between the RSI and its MA
- Color the RSI normal zone with the current trend/movement colors
- Show/Hide the screener indicating the current movement
Defaults Parameters
- Fast MA 20
- Slow MA 50
- MA source: Close
- RSI Length 14
- RSI MA: SMMA (RMA)
- RSI MA Length: 20
Don't hesitate to suggest any idea which could improve this indicator.
릴리즈 노트
Updates- Trend moving average crossovers are now displayed as xcrosses on the indicator (can be disabled)
- Overbought and oversold levels can be modified in options
릴리즈 노트
moving average crosses title modified 릴리즈 노트
50% line added오픈 소스 스크립트
트레이딩뷰의 진정한 정신에 따라, 이 스크립트의 작성자는 이를 오픈소스로 공개하여 트레이더들이 기능을 검토하고 검증할 수 있도록 했습니다. 작성자에게 찬사를 보냅니다! 이 코드는 무료로 사용할 수 있지만, 코드를 재게시하는 경우 하우스 룰이 적용된다는 점을 기억하세요.
면책사항
해당 정보와 게시물은 금융, 투자, 트레이딩 또는 기타 유형의 조언이나 권장 사항으로 간주되지 않으며, 트레이딩뷰에서 제공하거나 보증하는 것이 아닙니다. 자세한 내용은 이용 약관을 참조하세요.
오픈 소스 스크립트
트레이딩뷰의 진정한 정신에 따라, 이 스크립트의 작성자는 이를 오픈소스로 공개하여 트레이더들이 기능을 검토하고 검증할 수 있도록 했습니다. 작성자에게 찬사를 보냅니다! 이 코드는 무료로 사용할 수 있지만, 코드를 재게시하는 경우 하우스 룰이 적용된다는 점을 기억하세요.
면책사항
해당 정보와 게시물은 금융, 투자, 트레이딩 또는 기타 유형의 조언이나 권장 사항으로 간주되지 않으며, 트레이딩뷰에서 제공하거나 보증하는 것이 아닙니다. 자세한 내용은 이용 약관을 참조하세요.