PROTECTED SOURCE SCRIPT
Candle Sentiment Volume Flow
Candle Sentiment Volume Flow (CSVF)
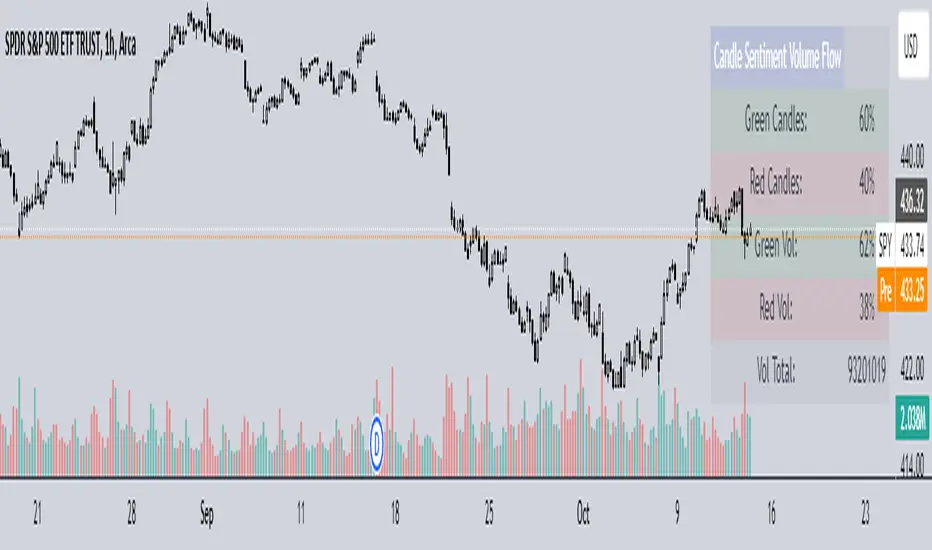
NOTE: The indicator showcased in the 1H chart is utilized on the ticker 'SPY'.

The Candle Sentiment Volume Flow (CSVF) is a custom trading indicator designed to analyze and visualize the momentum and volume flow of a financial instrument within a specified range of candles in a chart. It provides traders with a snapshot of the prevailing market sentiment by calculating the percentage of green (bullish) and red (bearish) candles and the volume associated with them over a defined range of periods (X Range).
Core Components:
1. Candle Counting:
- Green Count: Total number of green (bullish) candles in the defined range.
- Red Count: Total number of red (bearish) candles in the defined range.
2. Volume Calculation:
- Green Volume: Cumulative volume of green candles.
- Red Volume: Cumulative volume of red candles.
3. Percentage Calculation:
- Green Percentage: (Green Count / X Range) * 100
- Red Percentage: (Red Count / X Range) * 100
- Green Volume Percentage: (Green Volume / Total Volume) * 100
- Red Volume Percentage: (Red Volume / Total Volume) * 100
4. User-Defined Parameters:
- Candle Range (X Range): Number of candles to be considered for calculations.
- Green Threshold: User-defined percentage to identify significant bullish sentiment.
- Red Threshold: User-defined percentage to identify significant bearish sentiment.
Visual Component:
- Table Display:
A table is displayed on the top right of the chart, providing a quick overview of the calculated percentages and total volume.
The table is color-coded for easy interpretation and includes:
- Green and Red Candle Percentages
- Green and Red Volume Percentages
- Total Volume
Functional Workflow:
- The indicator loops through the past 'X' candles within the defined range, counting the number of green and red candles and accumulating their respective volumes.
- It calculates the percentage of green and red candles and the percentage of volume associated with them.
- The calculated values are displayed in a table on the chart, providing a clear and concise view of the candle sentiment and volume flow within the specified range.
NOTE: The indicator showcased in the 1H chart is utilized on the ticker 'SPY'.
The Candle Sentiment Volume Flow (CSVF) is a custom trading indicator designed to analyze and visualize the momentum and volume flow of a financial instrument within a specified range of candles in a chart. It provides traders with a snapshot of the prevailing market sentiment by calculating the percentage of green (bullish) and red (bearish) candles and the volume associated with them over a defined range of periods (X Range).
Core Components:
1. Candle Counting:
- Green Count: Total number of green (bullish) candles in the defined range.
- Red Count: Total number of red (bearish) candles in the defined range.
2. Volume Calculation:
- Green Volume: Cumulative volume of green candles.
- Red Volume: Cumulative volume of red candles.
3. Percentage Calculation:
- Green Percentage: (Green Count / X Range) * 100
- Red Percentage: (Red Count / X Range) * 100
- Green Volume Percentage: (Green Volume / Total Volume) * 100
- Red Volume Percentage: (Red Volume / Total Volume) * 100
4. User-Defined Parameters:
- Candle Range (X Range): Number of candles to be considered for calculations.
- Green Threshold: User-defined percentage to identify significant bullish sentiment.
- Red Threshold: User-defined percentage to identify significant bearish sentiment.
Visual Component:
- Table Display:
A table is displayed on the top right of the chart, providing a quick overview of the calculated percentages and total volume.
The table is color-coded for easy interpretation and includes:
- Green and Red Candle Percentages
- Green and Red Volume Percentages
- Total Volume
Functional Workflow:
- The indicator loops through the past 'X' candles within the defined range, counting the number of green and red candles and accumulating their respective volumes.
- It calculates the percentage of green and red candles and the percentage of volume associated with them.
- The calculated values are displayed in a table on the chart, providing a clear and concise view of the candle sentiment and volume flow within the specified range.
보호된 스크립트입니다
이 스크립트는 비공개 소스로 게시됩니다. 하지만 이를 자유롭게 제한 없이 사용할 수 있습니다 – 자세한 내용은 여기에서 확인하세요.
면책사항
해당 정보와 게시물은 금융, 투자, 트레이딩 또는 기타 유형의 조언이나 권장 사항으로 간주되지 않으며, 트레이딩뷰에서 제공하거나 보증하는 것이 아닙니다. 자세한 내용은 이용 약관을 참조하세요.
보호된 스크립트입니다
이 스크립트는 비공개 소스로 게시됩니다. 하지만 이를 자유롭게 제한 없이 사용할 수 있습니다 – 자세한 내용은 여기에서 확인하세요.
면책사항
해당 정보와 게시물은 금융, 투자, 트레이딩 또는 기타 유형의 조언이나 권장 사항으로 간주되지 않으며, 트레이딩뷰에서 제공하거나 보증하는 것이 아닙니다. 자세한 내용은 이용 약관을 참조하세요.