INVITE-ONLY SCRIPT
업데이트됨 Crude Oil Indicator [SIDD]
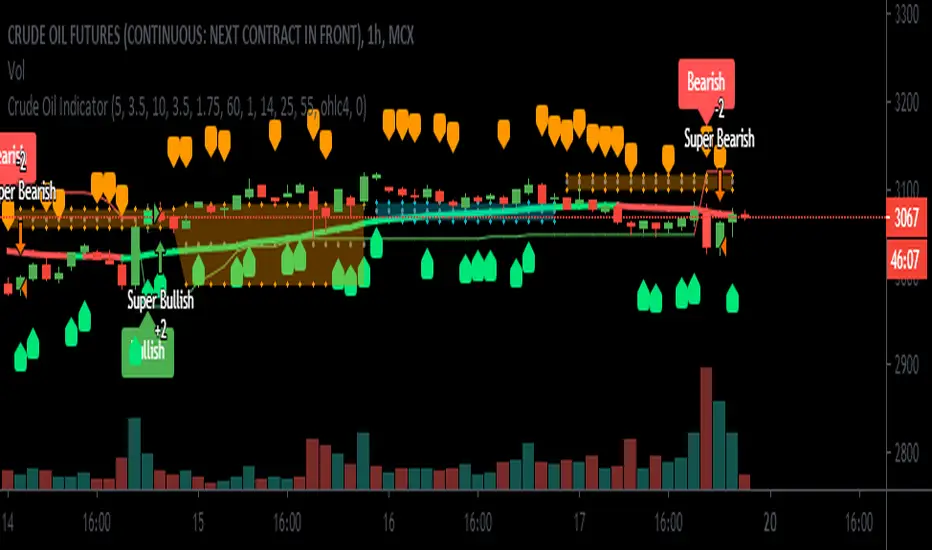
Crude Oil Indicator is giving two signal Bullish and Bearish . Bullish signal is used to take long trade and Bearish signal is used to close existing long trade and take new short trade and so on.
To get More signal of Bullish and Bearish user must enable More Signals check box that will check crossover and cross down of price close with Gaps.
I am using 2 ATR and one ADX and Gaps and VWMA to make signal profitable with 15 minutes 1 hr ,2hr,3hr,4hr chart time frame.
I have checked last few years data for back testing. Based on past performance it doesn't work well in 30 minute and 1 day chart time frame as results are not good in back testing. I have designed this indicator for Indian crude oil context though it can be used with other market as well.
1st ATR used to find trend with price crossover.
2nd ATR ADX is used to find the trend change details only. I have taken VWMA and ATR both to consider trend change.
Highlight Gap Up and Gap Down is used to know daily market opening gap up and gap down area. Gaps act as support and resistance .
VWMA Plotted as Blue line. Rising VWMA considered as uptrend and falling VWMA considered as downtrend.
Flat VWMA considered as no trend zone. In no trend zone every second third candles cross VWMA .
User must keep the default setting for getting better results as results are back tested. If setting changed then result may vary.
I have added here back tested performance user can see those results. I have added commission and slippage as well. Past year performance not guarantee for future years result so before taking any trade trader must take conscious decision.
This indicator is available on Subscription.
PM/ DM for more information about the script access.
Use the link below to obtain access to this indicator.
릴리즈 노트
Updated VWMA line color based on trend.Today checked with Gold and Natural Gas its working on that as well in positional trades.
릴리즈 노트
Added more signals with VWMA.Removed extra codes which are not useful.
릴리즈 노트
Added signals for consecutive candles based on open close so trend break can be identified.초대 전용 스크립트
이 스크립트는 작성자가 승인한 사용자만 접근할 수 있습니다. 사용하려면 요청 후 승인을 받아야 하며, 일반적으로 결제 후에 허가가 부여됩니다. 자세한 내용은 아래 작성자의 안내를 따르거나 bullsbearsclub에게 직접 문의하세요.
트레이딩뷰는 스크립트의 작동 방식을 충분히 이해하고 작성자를 완전히 신뢰하지 않는 이상, 해당 스크립트에 비용을 지불하거나 사용하는 것을 권장하지 않습니다. 커뮤니티 스크립트에서 무료 오픈소스 대안을 찾아보실 수도 있습니다.
작성자 지시 사항
Join my Educational Telegram channel:
t.me/bullsbearsclub
My YouTube channel: youtube.com/channel/UC537A
My Indicator details:
docs.google.com/document/d/17wUSbSJEZR6rTNVdwqLEBaKM-CSYx-61TN0qazvsnAQ/edit?usp=sharing
t.me/bullsbearsclub
My YouTube channel: youtube.com/channel/UC537A
My Indicator details:
docs.google.com/document/d/17wUSbSJEZR6rTNVdwqLEBaKM-CSYx-61TN0qazvsnAQ/edit?usp=sharing
면책사항
해당 정보와 게시물은 금융, 투자, 트레이딩 또는 기타 유형의 조언이나 권장 사항으로 간주되지 않으며, 트레이딩뷰에서 제공하거나 보증하는 것이 아닙니다. 자세한 내용은 이용 약관을 참조하세요.
초대 전용 스크립트
이 스크립트는 작성자가 승인한 사용자만 접근할 수 있습니다. 사용하려면 요청 후 승인을 받아야 하며, 일반적으로 결제 후에 허가가 부여됩니다. 자세한 내용은 아래 작성자의 안내를 따르거나 bullsbearsclub에게 직접 문의하세요.
트레이딩뷰는 스크립트의 작동 방식을 충분히 이해하고 작성자를 완전히 신뢰하지 않는 이상, 해당 스크립트에 비용을 지불하거나 사용하는 것을 권장하지 않습니다. 커뮤니티 스크립트에서 무료 오픈소스 대안을 찾아보실 수도 있습니다.
작성자 지시 사항
Join my Educational Telegram channel:
t.me/bullsbearsclub
My YouTube channel: youtube.com/channel/UC537A
My Indicator details:
docs.google.com/document/d/17wUSbSJEZR6rTNVdwqLEBaKM-CSYx-61TN0qazvsnAQ/edit?usp=sharing
t.me/bullsbearsclub
My YouTube channel: youtube.com/channel/UC537A
My Indicator details:
docs.google.com/document/d/17wUSbSJEZR6rTNVdwqLEBaKM-CSYx-61TN0qazvsnAQ/edit?usp=sharing
면책사항
해당 정보와 게시물은 금융, 투자, 트레이딩 또는 기타 유형의 조언이나 권장 사항으로 간주되지 않으며, 트레이딩뷰에서 제공하거나 보증하는 것이 아닙니다. 자세한 내용은 이용 약관을 참조하세요.