OPEN-SOURCE SCRIPT
Indicators: Better Volume Indicator & InstrumentVolume
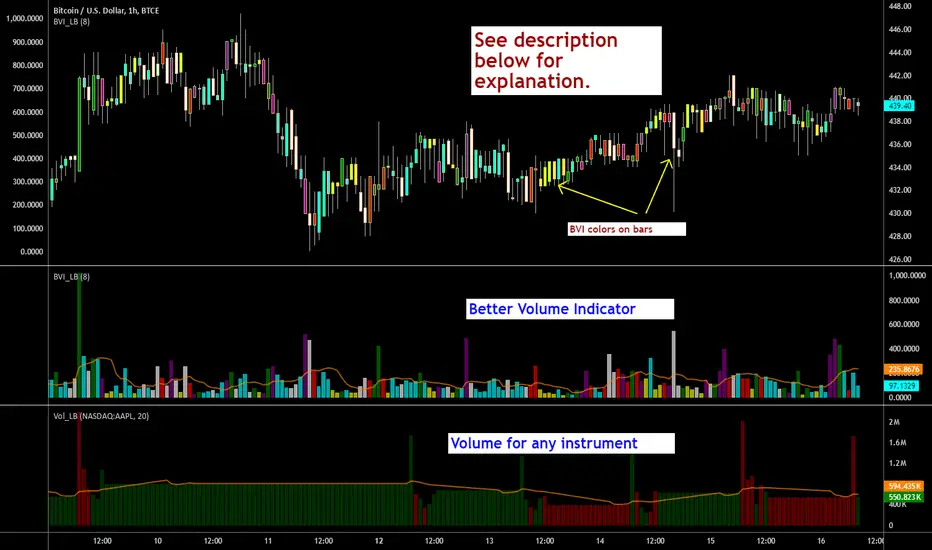
Better Volume Indicator [BVI]
-----------------------------------------
This is a direct port of a famous indicator from Tradestation platform.
BVI improves on your typical volume histogram by coloring the bars based on 5 criteria:
* Volume Climax Up – high volume, high range, up bars (red)
* Volume Climax Down – high volume, high range, down bars (white)
* High Volume Churn – high volume, low range bars (green, barcolor= blue)
* Low Volume – low volume bars (yellow)
* Volume Climax plus High Volume Churn – both the above conditions (magenta)
When there are no volume signals the default histogram bar coloring is cyan.
Bars can also be colored to match volume color. Enable "Change BarColors?" in the options page.
Volume Climax Up bars are typically seen at:
* The start of up trends
* The end of up trends, and
* Pullbacks during down trends.
Volume Climax Down bars are typically seen at:
* The start of down trends
* The end of down trends, and
* Pullbacks during up trends.
High Volume Churn bars are typically seen at:
* The end of up trends
* The end of down trends, and
* Profit taking mid-trend.
Low Volume bars are typically seen at:
* The end of up trends
* The end of down trends, and
* Pullbacks mid-trend.
More info:
emini-watch.com/free-stuff/volume-indicator/
Instrument Volume
-----------------------------------------
This is a simple script that allows you to plot volume for any instrument.
Very handy when you want to compare volumes. Just add multiple instances and select the symbol you want via Options page.
This script also gets close/open for the selected symbol. If you are itching to get started on Pinescripting (scripting language used at TV), I suggest trying out the following, using this script as the template:
- Show RSI for any instrument
(hint: "close" for the selected symbol is already in script. Do a "plot(rsi(c, 14))")
- MACD / CCI / ....
- Plot the difference (not correlation). This may be of interest in some instruments.
For ex. BTC in BTCE exchange mostly lags BITSTAMP.
Hope this piques your interest in Pine. Feel free to post in the Pinescript room if you have any queries.
-----------------------------------------
This is a direct port of a famous indicator from Tradestation platform.
BVI improves on your typical volume histogram by coloring the bars based on 5 criteria:
* Volume Climax Up – high volume, high range, up bars (red)
* Volume Climax Down – high volume, high range, down bars (white)
* High Volume Churn – high volume, low range bars (green, barcolor= blue)
* Low Volume – low volume bars (yellow)
* Volume Climax plus High Volume Churn – both the above conditions (magenta)
When there are no volume signals the default histogram bar coloring is cyan.
Bars can also be colored to match volume color. Enable "Change BarColors?" in the options page.
Volume Climax Up bars are typically seen at:
* The start of up trends
* The end of up trends, and
* Pullbacks during down trends.
Volume Climax Down bars are typically seen at:
* The start of down trends
* The end of down trends, and
* Pullbacks during up trends.
High Volume Churn bars are typically seen at:
* The end of up trends
* The end of down trends, and
* Profit taking mid-trend.
Low Volume bars are typically seen at:
* The end of up trends
* The end of down trends, and
* Pullbacks mid-trend.
More info:
emini-watch.com/free-stuff/volume-indicator/
Instrument Volume
-----------------------------------------
This is a simple script that allows you to plot volume for any instrument.
Very handy when you want to compare volumes. Just add multiple instances and select the symbol you want via Options page.
This script also gets close/open for the selected symbol. If you are itching to get started on Pinescripting (scripting language used at TV), I suggest trying out the following, using this script as the template:
- Show RSI for any instrument
(hint: "close" for the selected symbol is already in script. Do a "plot(rsi(c, 14))")
- MACD / CCI / ....
- Plot the difference (not correlation). This may be of interest in some instruments.
For ex. BTC in BTCE exchange mostly lags BITSTAMP.
Hope this piques your interest in Pine. Feel free to post in the Pinescript room if you have any queries.
오픈 소스 스크립트
트레이딩뷰의 진정한 정신에 따라, 이 스크립트의 작성자는 이를 오픈소스로 공개하여 트레이더들이 기능을 검토하고 검증할 수 있도록 했습니다. 작성자에게 찬사를 보냅니다! 이 코드는 무료로 사용할 수 있지만, 코드를 재게시하는 경우 하우스 룰이 적용된다는 점을 기억하세요.
List of my free indicators: bit.ly/1LQaPK8
List of my indicators at Appstore: blog.tradingview.com/?p=970
List of my indicators at Appstore: blog.tradingview.com/?p=970
면책사항
해당 정보와 게시물은 금융, 투자, 트레이딩 또는 기타 유형의 조언이나 권장 사항으로 간주되지 않으며, 트레이딩뷰에서 제공하거나 보증하는 것이 아닙니다. 자세한 내용은 이용 약관을 참조하세요.