OPEN-SOURCE SCRIPT
Volume Strength
The "Volume Strength" indicator
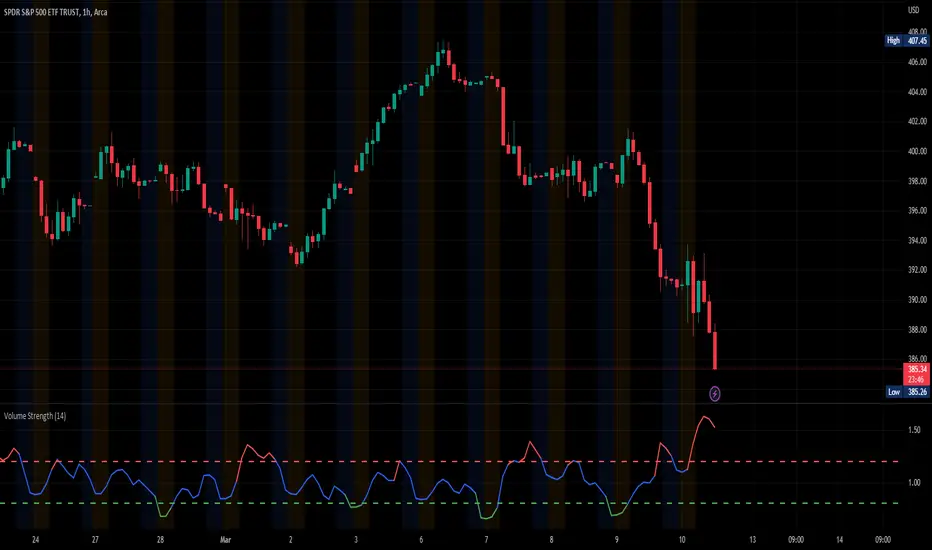
A technical analysis tool that helps traders evaluate the strength of the current market trend by measuring the cumulative volume over a specified period of time. It calculates the cumulative volume of a stock and divides it by the average cumulative volume over a specified period. This ratio is referred to as the "volume strength" and is plotted as a line on a chart. The indicator also provides overbought and oversold levels, which are horizontal lines on the chart that represent predetermined levels of overbought and oversold conditions.
The color of the volume strength line changes based on the current strength level. If the line is above the overbought level, it is colored red. If the line is below the oversold level, it is colored green. If the line is between the overbought and oversold levels, it is colored blue. The indicator also provides alerts for overbought and oversold conditions.
HOW TO USE:
1. Load the indicator onto the chart of the desired market. It works best in markets where volume data is available, such as stocks, futures, indices and cryptocurrencies. But you can also use it in the Forex market, where tick volume data will be used to calculate the indicator.
2. Adjust the length parameter to set the period for which the cumulative volume is calculated and the average cumulative volume is calculated.
3. Adjust the overbought and oversold levels as desired. These levels determine the horizontal lines that represent overbought and oversold conditions on the chart.
4. Observe the volume strength line and the overbought/oversold levels on the chart. If the volume strength line is red, the volume is considered overbought. If the line is green, the volume is considered oversold. If the line is blue, the volume is considered to be between the overbought and oversold levels. The indicator will provide alerts for overbought and oversold conditions. The indicator is an excellent tool for finding price-volume divergences.
SETTINGS:
Length: The period over which the cumulative volume is calculated and the average cumulative volume is calculated. The default is 14.
Overbought Level: The level at which the volume is considered overbought. The default is 1.2.
Oversold Level: The level at which the volume is considered oversold. The default is 0.8.
Please leave a comment & like :)
오픈 소스 스크립트
트레이딩뷰의 진정한 정신에 따라, 이 스크립트의 작성자는 이를 오픈소스로 공개하여 트레이더들이 기능을 검토하고 검증할 수 있도록 했습니다. 작성자에게 찬사를 보냅니다! 이 코드는 무료로 사용할 수 있지만, 코드를 재게시하는 경우 하우스 룰이 적용된다는 점을 기억하세요.
Access our exclusive tools at: angelalgo.com
Join our community via discord.gg/FGUTfkmYbW
All content from AngelAlgo is for informational and educational purposes only. Please note that past performance does not guarantee future results.
Join our community via discord.gg/FGUTfkmYbW
All content from AngelAlgo is for informational and educational purposes only. Please note that past performance does not guarantee future results.
면책사항
해당 정보와 게시물은 금융, 투자, 트레이딩 또는 기타 유형의 조언이나 권장 사항으로 간주되지 않으며, 트레이딩뷰에서 제공하거나 보증하는 것이 아닙니다. 자세한 내용은 이용 약관을 참조하세요.