OPEN-SOURCE SCRIPT
MTF EMA Trend
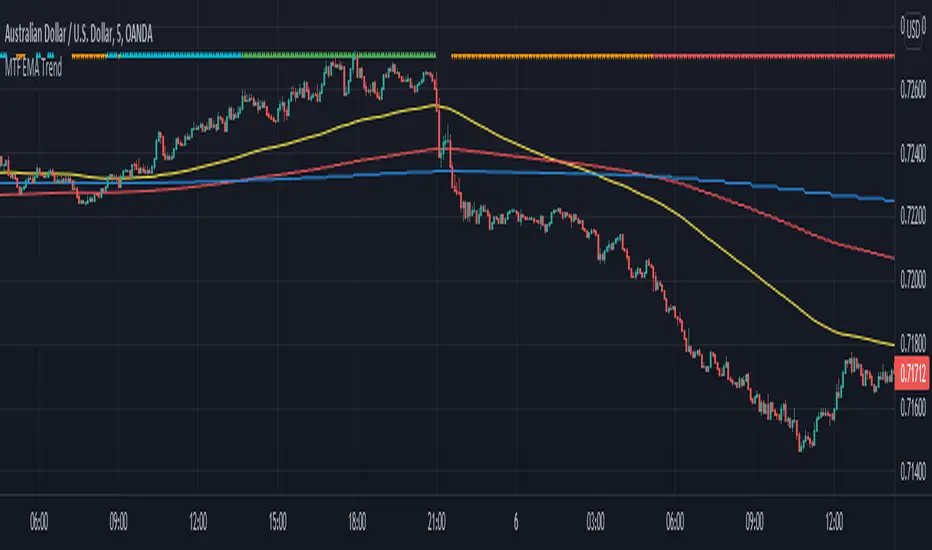
The indicator plots directional arrows on top of the chart to visualize the market's price trend. The plots are based on candle closing below all three multitimeframe EMAs, downtrend, when the EMAs are also in order (1 below 2 and 2 below 3). Opposite situation is uptrend.
It also marks a breakdown when the price closes under the third (supposedly always the slowest) EMA outside of aforementioned downtrend situation. Opposite is true for breakup to be marked.
Please always make sure, that the three EMAs are in order of EMA 1 being the fastest and 3rd the slowest. Default settings are used on the 5 minute timeframe.
Indicator can be used to quickly check the overall trend of the market as told by three MTF EMAs without needing to clutter the chart with the actual EMA plots. This is useful, for example, if you mainly base your scalping trades on other types of indicators, but you want a quick peek of the market direction or indecision.
오픈 소스 스크립트
트레이딩뷰의 진정한 정신에 따라, 이 스크립트의 작성자는 이를 오픈소스로 공개하여 트레이더들이 기능을 검토하고 검증할 수 있도록 했습니다. 작성자에게 찬사를 보냅니다! 이 코드는 무료로 사용할 수 있지만, 코드를 재게시하는 경우 하우스 룰이 적용된다는 점을 기억하세요.
면책사항
해당 정보와 게시물은 금융, 투자, 트레이딩 또는 기타 유형의 조언이나 권장 사항으로 간주되지 않으며, 트레이딩뷰에서 제공하거나 보증하는 것이 아닙니다. 자세한 내용은 이용 약관을 참조하세요.
오픈 소스 스크립트
트레이딩뷰의 진정한 정신에 따라, 이 스크립트의 작성자는 이를 오픈소스로 공개하여 트레이더들이 기능을 검토하고 검증할 수 있도록 했습니다. 작성자에게 찬사를 보냅니다! 이 코드는 무료로 사용할 수 있지만, 코드를 재게시하는 경우 하우스 룰이 적용된다는 점을 기억하세요.
면책사항
해당 정보와 게시물은 금융, 투자, 트레이딩 또는 기타 유형의 조언이나 권장 사항으로 간주되지 않으며, 트레이딩뷰에서 제공하거나 보증하는 것이 아닙니다. 자세한 내용은 이용 약관을 참조하세요.