OPEN-SOURCE SCRIPT
업데이트됨 Consolidation VWAP's [QuantVue]
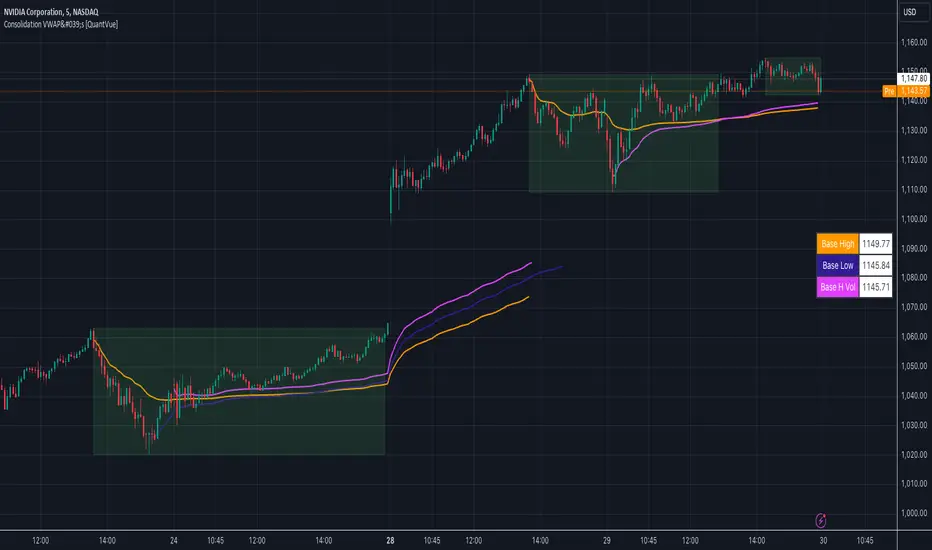
Introducing the Consolidation VWAP's Indicator, a powerful tool designed to identify consolidation periods in stock advance and automatically anchor three distinct VWAPs to key points within the consolidation.
Consolidation Period Identification:
The indicator automatically detects periods of consolidation or areas on the chart where a stock's price moves sideways within a defined range. This period can be seen as the market taking a "breather" as it digests the previous gains. Consolidations are important because they often act as a base for the next move, either continuing the previous uptrend or reversing direction.
Consolidation requirements can be customized by the user to match your instrument and timeframe.

Anchored VWAP, or Anchored Volume-Weighted Average Price, is a technical analysis tool used to determine the average price of a stock weighted by volume, starting from a specific point in time chosen by the analyst.
Unlike traditional VWAP, which starts at the beginning of the trading session, the anchored VWAP allows traders to select any point on the chart, such as a significant event, price low, high, or a breakout, to begin the calculation.
VWAP incorporates price and volume in a weighted average and can be used to identify areas of support and resistance on the chart.
VWAP Anchored to Consolidation High: This VWAP is anchored at the highest price point within the identified consolidation period. It helps traders understand the
average price paid by buyers who entered at the peak of the consolidation.
VWAP Anchored to Consolidation Low: This VWAP is anchored at the lowest price point within the consolidation. It provides insights into the average price paid by
buyers who entered at the lowest point of the consolidation.
VWAP Anchored to Highest Volume in the Consolidation: This VWAP is anchored at the price level with the highest trading volume during the consolidation. It reflects the average price at
which the most trading activity occurred, often indicating a key support or resistance level.

The indicator also allows the trader to see past consolidation areas and previous anchored VWAP's.

Give this indicator a BOOST and COMMENT your thoughts!
We hope you enjoy.
Cheers!
Consolidation Period Identification:
The indicator automatically detects periods of consolidation or areas on the chart where a stock's price moves sideways within a defined range. This period can be seen as the market taking a "breather" as it digests the previous gains. Consolidations are important because they often act as a base for the next move, either continuing the previous uptrend or reversing direction.
Consolidation requirements can be customized by the user to match your instrument and timeframe.
- Maximum Consolidation Depth
- Minimum Consolidation Length
- Maximum Consolidation Length
- Prior Uptrend Amount
Anchored VWAP, or Anchored Volume-Weighted Average Price, is a technical analysis tool used to determine the average price of a stock weighted by volume, starting from a specific point in time chosen by the analyst.
Unlike traditional VWAP, which starts at the beginning of the trading session, the anchored VWAP allows traders to select any point on the chart, such as a significant event, price low, high, or a breakout, to begin the calculation.
VWAP incorporates price and volume in a weighted average and can be used to identify areas of support and resistance on the chart.
VWAP Anchored to Consolidation High: This VWAP is anchored at the highest price point within the identified consolidation period. It helps traders understand the
average price paid by buyers who entered at the peak of the consolidation.
VWAP Anchored to Consolidation Low: This VWAP is anchored at the lowest price point within the consolidation. It provides insights into the average price paid by
buyers who entered at the lowest point of the consolidation.
VWAP Anchored to Highest Volume in the Consolidation: This VWAP is anchored at the price level with the highest trading volume during the consolidation. It reflects the average price at
which the most trading activity occurred, often indicating a key support or resistance level.
The indicator also allows the trader to see past consolidation areas and previous anchored VWAP's.
Give this indicator a BOOST and COMMENT your thoughts!
We hope you enjoy.
Cheers!
릴리즈 노트
Updated default settings.오픈 소스 스크립트
트레이딩뷰의 진정한 정신에 따라, 이 스크립트의 작성자는 이를 오픈소스로 공개하여 트레이더들이 기능을 검토하고 검증할 수 있도록 했습니다. 작성자에게 찬사를 보냅니다! 이 코드는 무료로 사용할 수 있지만, 코드를 재게시하는 경우 하우스 룰이 적용된다는 점을 기억하세요.
Get Access to the exclusive QuantVue indicators: quantvue.io/
Join thousands of traders in our Free Discord: discord.gg/tC7u7magU3
Join thousands of traders in our Free Discord: discord.gg/tC7u7magU3
면책사항
해당 정보와 게시물은 금융, 투자, 트레이딩 또는 기타 유형의 조언이나 권장 사항으로 간주되지 않으며, 트레이딩뷰에서 제공하거나 보증하는 것이 아닙니다. 자세한 내용은 이용 약관을 참조하세요.
오픈 소스 스크립트
트레이딩뷰의 진정한 정신에 따라, 이 스크립트의 작성자는 이를 오픈소스로 공개하여 트레이더들이 기능을 검토하고 검증할 수 있도록 했습니다. 작성자에게 찬사를 보냅니다! 이 코드는 무료로 사용할 수 있지만, 코드를 재게시하는 경우 하우스 룰이 적용된다는 점을 기억하세요.
Get Access to the exclusive QuantVue indicators: quantvue.io/
Join thousands of traders in our Free Discord: discord.gg/tC7u7magU3
Join thousands of traders in our Free Discord: discord.gg/tC7u7magU3
면책사항
해당 정보와 게시물은 금융, 투자, 트레이딩 또는 기타 유형의 조언이나 권장 사항으로 간주되지 않으며, 트레이딩뷰에서 제공하거나 보증하는 것이 아닙니다. 자세한 내용은 이용 약관을 참조하세요.