INVITE-ONLY SCRIPT
RSI MACD CLOCKWORK TABLE
What you get, at a glance:
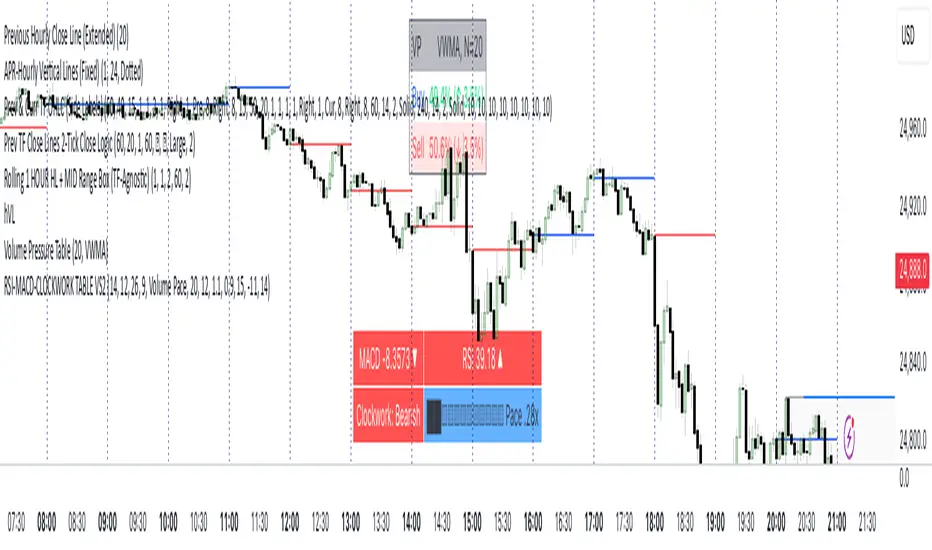
• MACD Cell — Shows the current MACD value and a small direction icon (▲ rising, ▼ falling, ⏺ flat). The background color adapts to regime: green above zero, red below zero, gray near the line. Lengths are configurable (fast/slow/signal).
• RSI Cell — Plots the latest RSI with an identical direction icon and background logic (green above 50, red below 50, gray around 50). RSI length is configurable.
• Clockwork Row — This is the structure check. The script computes the slope (in degrees) of EMA(5), EMA(8), and EMA(13). If all three exceed your bullish threshold, you’ll see “Clockwork: Bullish” (lime). If all three are below your bearish threshold, you’ll see “Clockwork: Bearish” (red). Otherwise, it’s “Neutral” (gray). Thresholds are fully user-tunable.
Smart right-hand cell (choose your readout):
• Duplicate — Mirrors the Clockwork label.
• Time to Close — A clean mm:ss countdown for the current timeframe (with safe defaults on unusual timeframes).
• Slope Degrees — Prints the 5/8/13 EMA slopes in degrees (e.g., +12.3°).
• Slope Pack ▲▼ — Only the direction of each slope (less noise, more speed).
• EMA Spread (5↔13) — Shows the slope differential (degrees) between short and long EMAs.
• Volume Pace — Projects end-of-bar volume from live progress, compares it to your N-bar average, and renders a tiny text progress bar (██░░…) with a neutral “thermo” palette: black = hot (> high threshold), light blue = cold (< low threshold), silver = typical. All inputs (length, bar width, thresholds) are configurable.
• ATR — Current ATR with direction vs previous bar (▲/▼/⏺).
Quality-of-life:
• Optional top padding (~20px) to keep the table visually separated from other overlays.
• Lightweight string/emoji UI for clarity without heavy graphics.
• Defensive guards around timeframe math so the TTC keeps working smoothly.
How to use:
Add to any symbol/timeframe.
Set your MACD/RSI lengths and Clockwork slope thresholds to match your system’s sensitivity.
Pick a right-cell mode that complements your workflow (TTC for day trading, Volume Pace for intrabar context, ATR for volatility).
Note: This tool is informational, not a standalone signal generator. Combine the Clockwork alignment with your entries/exits and risk management.
초대 전용 스크립트
이 스크립트는 작성자가 승인한 사용자만 접근할 수 있습니다. 사용하려면 요청 후 승인을 받아야 하며, 일반적으로 결제 후에 허가가 부여됩니다. 자세한 내용은 아래 작성자의 안내를 따르거나 EliteTradingIndicators에게 직접 문의하세요.
트레이딩뷰는 스크립트의 작동 방식을 충분히 이해하고 작성자를 완전히 신뢰하지 않는 이상, 해당 스크립트에 비용을 지불하거나 사용하는 것을 권장하지 않습니다. 커뮤니티 스크립트에서 무료 오픈소스 대안을 찾아보실 수도 있습니다.
작성자 지시 사항
RSI-MACD-CLOCKWORK TABLE VS2 is a compact, no-nonsense dashboard that sits on your main chart and keeps three pillars of momentum/structure in view: MACD, RSI, and a “Clockwork” slope alignment check across EMAs.
면책사항
해당 정보와 게시물은 금융, 투자, 트레이딩 또는 기타 유형의 조언이나 권장 사항으로 간주되지 않으며, 트레이딩뷰에서 제공하거나 보증하는 것이 아닙니다. 자세한 내용은 이용 약관을 참조하세요.