INVITE-ONLY SCRIPT
(10) Launch Pad VS-144
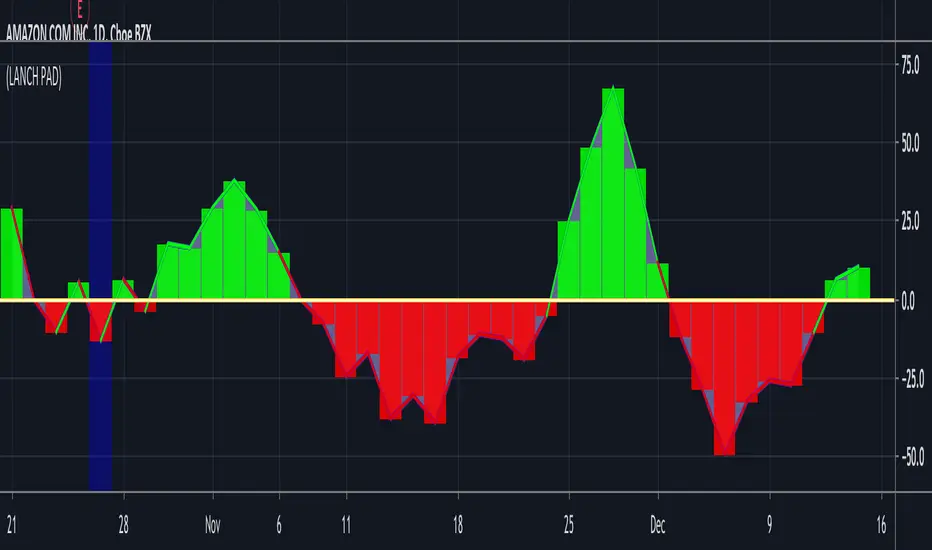
The Launch Pad Indicator, utilizes the tendency of stocks that have dropped below the center-line of a moving average, to snap back to the center-line and then exceed that center-line by approximately the same magnitude as the prior drop. This is referred to as, reversion to mean. You can see clear evidence for mean reversions in all stocks, equities and publicly traded financial instruments. Launch Pad, makes the visualization of these opportunities obvious. Stocks already in a long term up-trend offer the best targets of opportunity. This make them desirable stocks to enter and because this pullback now provides a new, more favorable entry opportunity, the pent-up demand to own this stock, combined with this new entry opportunity, often pushes these stock much higher than your entry price. Your average short-term profit expectations for this signal is a move above the zero line that is proportionally equal to the prior move below the zero line or two times the equitie's most recent low below the center line. Launch Pad alerts traders to these frequent and profitable reversion/divergent opportunities, allowing us to visualize, quantify and then capitalize on these obvious and unmistakable signals.
Launch Pad provides you with a visual conformation of the forces associated with the downward pressure exerted on the stock, moving it below the moving average as well as it’s reversion potential that the stock’s price action has produced. The positive potential is at least equal to the negative deviation from the moving average. This same indicator also clearly indicates exactly when the stocks price swings past it’s normal state, i.e., the moving average represented by the zero line. This produces an immediate indication of when the reversal of price has occurred and clear entry signals.
Launch Pad provides you with a visual conformation of the forces associated with the downward pressure exerted on the stock, moving it below the moving average as well as it’s reversion potential that the stock’s price action has produced. The positive potential is at least equal to the negative deviation from the moving average. This same indicator also clearly indicates exactly when the stocks price swings past it’s normal state, i.e., the moving average represented by the zero line. This produces an immediate indication of when the reversal of price has occurred and clear entry signals.
초대 전용 스크립트
이 스크립트는 작성자가 승인한 사용자만 접근할 수 있습니다. 사용하려면 요청 후 승인을 받아야 하며, 일반적으로 결제 후에 허가가 부여됩니다. 자세한 내용은 아래 작성자의 안내를 따르거나 StockSwinger에게 직접 문의하세요.
트레이딩뷰는 스크립트의 작동 방식을 충분히 이해하고 작성자를 완전히 신뢰하지 않는 이상, 해당 스크립트에 비용을 지불하거나 사용하는 것을 권장하지 않습니다. 커뮤니티 스크립트에서 무료 오픈소스 대안을 찾아보실 수도 있습니다.
작성자 지시 사항
면책사항
해당 정보와 게시물은 금융, 투자, 트레이딩 또는 기타 유형의 조언이나 권장 사항으로 간주되지 않으며, 트레이딩뷰에서 제공하거나 보증하는 것이 아닙니다. 자세한 내용은 이용 약관을 참조하세요.