PROTECTED SOURCE SCRIPT
Treat Sideways
👉 What is this indicator ?
Understanding the Sideways Trend is the best trading method, and we have written this script intending to make you a better sideways filter indicator. Treat Sideways helps you understand the sideways trend and trade in a risk free manner.
👉 On which coins can this indicator be used ?
This indicator is best used on all cryptocurrencies, stocks , forex markets
👉 How work this indicator ?
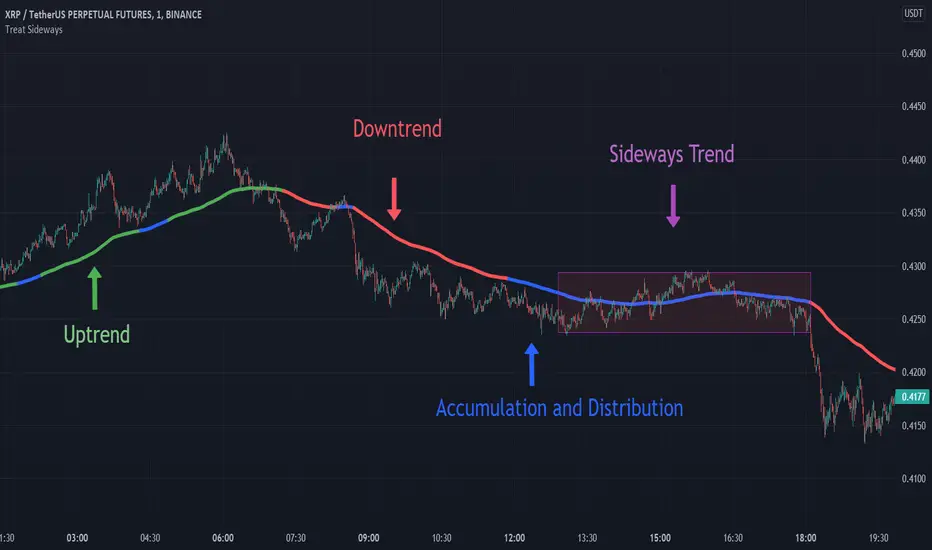
We understand the trend using our secret logic and price action, and After that, we mark the sideways movement in a box. The moving average line helps us to construct this indicator.
👉 Default Coin and Time Frame ?
XRPUSDT
Time Frame : 1 min
MA Line Color Details 👇
The Blue color of the MA line indicates the Sideways Trend
The Red color of the MA line indicates the Down Trend
The Green color of the MA line indicates the Up Trend
Indicator Settings 👇
Box Height : This setting can be used to set the size of the Sideways trend
Time Gap : This option is used to control unexpected down trend and up trend
Up Down Threshold : This option should be adjusted according to the time frame and voltality
Color :
Option to change the color of the box that appears in the sideways trend
Border Color : Option to change the color of the box border that appears in the sideways trend
Opacity : Option to change the opacity of the box border that appears in the sideways trend
Line Width : You can adjust the width of the MA line with this option
Understanding the Sideways Trend is the best trading method, and we have written this script intending to make you a better sideways filter indicator. Treat Sideways helps you understand the sideways trend and trade in a risk free manner.
👉 On which coins can this indicator be used ?
This indicator is best used on all cryptocurrencies, stocks , forex markets
👉 How work this indicator ?
We understand the trend using our secret logic and price action, and After that, we mark the sideways movement in a box. The moving average line helps us to construct this indicator.
👉 Default Coin and Time Frame ?
XRPUSDT
Time Frame : 1 min
MA Line Color Details 👇
The Blue color of the MA line indicates the Sideways Trend
The Red color of the MA line indicates the Down Trend
The Green color of the MA line indicates the Up Trend
Indicator Settings 👇
Box Height : This setting can be used to set the size of the Sideways trend
Time Gap : This option is used to control unexpected down trend and up trend
Up Down Threshold : This option should be adjusted according to the time frame and voltality
Color :
Option to change the color of the box that appears in the sideways trend
Border Color : Option to change the color of the box border that appears in the sideways trend
Opacity : Option to change the opacity of the box border that appears in the sideways trend
Line Width : You can adjust the width of the MA line with this option
보호된 스크립트입니다
이 스크립트는 클로즈 소스로 게시되며 자유롭게 사용할 수 있습니다. 당신은 스크립트를 차트에 사용하기 위해 그것을 즐겨찾기 할 수 있습니다. 소스 코드는 보거나 수정할 수 없습니다.
차트에 이 스크립트를 사용하시겠습니까?
면책사항
이 정보와 게시물은 TradingView에서 제공하거나 보증하는 금융, 투자, 거래 또는 기타 유형의 조언이나 권고 사항을 의미하거나 구성하지 않습니다. 자세한 내용은 이용 약관을 참고하세요.